
Wiggers diagram

Red = aortic pressure
Blue = left ventricular pressure
Yellow = left atrial pressure.
Editor-In-Chief: C. Michael Gibson, M.S., M.D. [1]
A Wiggers diagram is a standard diagram used in cardiac physiology.
The X axis is used to plot time, while the Y axis contains all of the following on a single grid:
- Blood pressure
- Aortic pressure
- Ventricular pressure
- Atrial pressure
- Ventricular volume
- Electrocardiogram
- Arterial flow (optional)
- Heart sounds (optional)
By illustrating the coordinated variation of these values, it becomes easier to illustrate the relationship between these values in the cardiac cycle.
Etymology
Etymology
It is named after Carl J. Wiggers. (The diagram is frequently incorrectly called a “Wigger’s diagram”. Although “Wiggers’ diagram” would be grammatically correct, it is more frequently rendered “Wiggers diagram”, with no apostrophe.)
Events
Events
| Phase | EKG | Heart sounds | Aortic valve | Mitral valve | |
| A | Atrial systole | P | S4* | closed | open |
| B | Ventricular systole – Isovolumetric/isovolumic contraction | QRS | S1 (“lub”) | closed | closed |
| C1 | Ventricular systole – Ejection 1 | – | open | closed | |
| C2 | Ventricular systole – Ejection 2 | T | open | closed | |
| D | Ventricular diastole – Isovolumetric/isovolumic relaxation | – | S2 (“dub”) | closed | closed |
| E1 | Ventricular diastole – Ventricular filling 1 | – | S3* | closed | open |
| E2 | Ventricular diastole – Ventricular filling 2 | – | closed | open |
Note that during isovolumetric/isovolumic contraction and relaxation, all the heart valves are closed. At no time are all the heart valves open.
- S3 and S4 heart sounds are associated with pathologies and are not routinely heard.
Additional images
Additional images
-
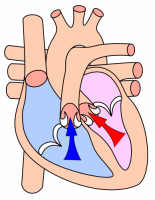 Ventricular systole
 -
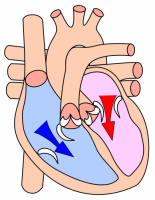 Cardiac diastole
 -
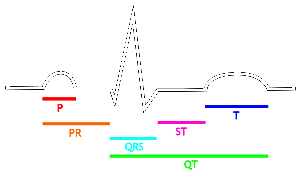 The EKG complex. P=P wave, PR=PR interval, QRS=QRS complex, QT=QT interval, ST=ST segment, T=T wave


Looking for the patient version?
© 2026 MyEClinic – IFTM Institut für Telematik in der Medizin GmbH