

Health Dictionary
Reliable, easy-to-read patient information on common medical conditions — written in plain language, free of jargon, and grounded in current evidence. Browse the most frequent diagnoses, understand what they mean for everyday life, and learn which steps and questions help you have a focused conversation with your doctor.
Influenza (Flu) (For Medical Professionals)
Introduction
For patient information click here
For more information about non-human (variant) influenza viruses that may be transmitted to humans, see Zoonotic influenza
Synonyms and keywords: Flu; influenza A; influenza B; influenza C; human influenza; human influenza virus
Overview
Overview
Influenza is an acute viral respiratory disease caused by influenza viruses (family Orthomyxoviridae), primarily influenza A and B, which circulate worldwide and cause annual epidemics of variable severity.[1] The clinical spectrum ranges from asymptomatic infection and self-limited upper respiratory illness to severe pneumonia, multiorgan complications, and death.[1]
Causative Agents
Four types of influenza viruses (A, B, C, D) are recognized.[1][2]
- Influenza A and B: Cause seasonal epidemics in humans. Influenza A viruses are subtyped by hemagglutinin (HA) and neuraminidase (NA); A(H1N1)pdm09 and A(H3N2) currently circulate. Influenza B viruses are divided into B/Victoria and B/Yamagata lineages, with B/Yamagata undetected since March 2020.[1]
- Influenza C: Causes mild illness and does not cause epidemics.[2][3]
- Influenza D: Primarily infects cattle and is not known to cause human disease.[1][3]
Influenza A viruses also circulate in animal reservoirs and can cause zoonotic infections.[4][1]
Disease Burden
| Data Category | Global (Annual) | U.S. (Annual) |
|---|---|---|
| Severe Illness | 3–5 million cases[1] | 9–45 million symptomatic illnesses[5] |
| Hospitalizations | Not specified | 140,000–710,000 hospitalizations[5] |
| Deaths | 290,000–650,000 respiratory deaths[6] | 12,000–52,000 deaths[5] |
| Pediatric Illness | >110 million illnesses in children <5 years[1][7] | Not specified |
The 2024–2025 U.S. season was high-severity, with an estimated 47–82 million illnesses, 610,000–1,300,000 hospitalizations, and the highest cumulative hospitalization rate (127.1 per 100,000) since 2010–2011.[8][9] During the 2024–2025 season, at least 63 pediatric influenza-associated deaths were reported.[9] Nearly 50% of all-cause deaths among hospitalized influenza patients occur within 30 days after discharge.[10]
Populations at increased risk include adults ≥65 years, persons aged 50–64 years, children <5 years, pregnant people, American Indian/Alaska Native persons, individuals with extreme obesity (BMI ≥40), individuals with chronic medical conditions (including pulmonary, cardiovascular, renal, hepatic, neurologic/neurodevelopmental, hematologic, and metabolic disorders), immunocompromised persons, residents of long-term care facilities, and children/adolescents receiving aspirin or salicylate-containing medications (risk of Reye syndrome).[1][5][11][9] Racial and ethnic disparities persist, with higher age-adjusted hospitalization rates among Black, American Indian/Alaska Native, and Hispanic populations.[12][13]
Key Clinical Features
The classic presentation is abrupt onset of fever, cough, myalgias, headache, and malaise, often with sore throat and nasal congestion.[1][5][14] Fever may be absent, particularly in older adults and immunocompromised patients.[1] Uncomplicated illness typically resolves within 3–7 days.
Complications include primary viral pneumonia, secondary bacterial pneumonia, exacerbation of underlying chronic conditions, and increasingly recognized cardiovascular events such as acute myocardial infarction and stroke, particularly in older adults.[1][15]
During community influenza activity, the combination of cough and fever has a positive predictive value ranging from 30–88% for influenza, depending on host factors and community activity levels. In populations with confirmed influenza activity, PPV has been reported as high as 79% in one pooled analysis, though this estimate derived from patients pre-selected for feverishness and may overstate diagnostic precision in broader clinical settings.[16][5]
Diagnosis at a Glance
Molecular assays (RT-PCR, rapid molecular tests) are preferred for diagnosis due to high sensitivity and specificity.[14][5][17]
- Rapid antigen detection tests are widely available but have moderate sensitivity (50–70%); negative results in symptomatic patients should be confirmed with molecular testing.
Clinical diagnosis (fever + cough) is reasonable in outpatient settings during confirmed influenza activity, but laboratory confirmation is recommended for hospitalized patients.[17][18]
Treatment at a Glance
Four FDA-approved antiviral agents are available:[1][19][5]
- Oseltamivir (oral): Preferred for hospitalized patients.
- Baloxavir (oral): Single-dose convenience, superior viral load reduction.
- Zanamivir (inhaled): Alternative agent.
- Peramivir (IV): Alternative agent. Note: FDA labeling states that efficacy has not been established in patients with serious influenza requiring hospitalization.[20]
WHO conditionally recommends oseltamivir for severe influenza and baloxavir for patients at high risk of progression from non-severe to severe illness.[18] Treatment provides greatest benefit when started within 48 hours of symptom onset but should still be considered beyond this window in hospitalized or high-risk patients.[1][5]
Prevention at a Glance
Annual influenza vaccination is recommended for all persons ≥6 months without contraindications.[11]
- All U.S. vaccines for the 2025–2026 season are trivalent formulations.
- Preferential vaccines for adults ≥65 years: high-dose IIV3, adjuvanted IIV3, or RIV3.[11]
Post-exposure chemoprophylaxis with oseltamivir, zanamivir, or baloxavir is conditionally recommended for persons at extremely high risk.[18][21] While the WHO guideline also includes laninamivir, this agent is not FDA-approved and is only available in Japan.[22]
Emerging Concerns
- A new influenza A(H3N2) subclade K (J.2.4.1), identified in August 2025, shows antigenic drift from the 2025–2026 vaccine virus component.[23]
- Highly pathogenic avian influenza A(H5N1) continues to circulate among wild birds and dairy cattle in the United States, with 70 human cases reported as of July 2025, primarily in association with occupational exposure to infected animals.[9][24]
Key Clinical Pearls
- Consider influenza in any patient with acute respiratory symptoms during community activity, even without fever.
- Nearly 90% of influenza-hospitalized patients have at least one underlying medical condition.[8][25]
- Do not delay antiviral treatment pending test results in hospitalized or high-risk patients.
- Do not withhold treatment solely because >48 hours have elapsed since symptom onset in high-risk patients.
- Arrange follow-up for discharged patients; nearly half of influenza-associated deaths occur post-discharge.[10]
References
- ↑ 1.00 1.01 1.02 1.03 1.04 1.05 1.06 1.07 1.08 1.09 1.10 1.11 1.12 1.13 Uyeki, TM; Hui, DS; Zambon, M; Wentworth, DE; Monto, AS (2022). “Influenza”. Lancet. 400 (10353): 693–706. doi:10.1016/S0140-6736(22)00982-5. PMID 35964587 Check
|pmid=value (help). - ↑ 2.0 2.1 Paules, C; Subbarao, K (2017). “Influenza”. Lancet. 390 (10095): 697–708. doi:10.1016/S0140-6736(17)30129-0. PMID 28302313.
- ↑ 3.0 3.1 Javanian, M; Barary, M; Ghebrehewet, S (2021). “A brief review of influenza virus infection”. J Med Virol. 93 (8): 4638–4646. doi:10.1002/jmv.26990. PMID 33837935 Check
|pmid=value (help). - ↑ Nakhaie, M (2024). “A Closer Look at the Avian Influenza Virus H7N9: A Calm before the Storm?”. J Med Virol. 96 (11): e70090. doi:10.1002/jmv.70090. PMID 38938347 Check
|pmid=value (help). - ↑ 5.0 5.1 5.2 5.3 5.4 5.5 5.6 5.7 5.8 Valleau, Molly; Szablewski, Christine M. (2025). “Influenza”. CDC Yellow Book. U.S. Centers for Disease Control and Prevention.
- ↑ Iuliano, AD (2018). “Estimates of Global Seasonal Influenza-Associated Respiratory Mortality: A Modelling Study”. Lancet. 391 (10127): 1285–1300. doi:10.1016/S0140-6736(17)33293-2. PMID 29248255.
- ↑ Wang, X (2020). “Global burden of respiratory infections associated with seasonal influenza in children under 5 years in 2018: a systematic review and modelling study”. Lancet Glob Health. 8 (4): e497–e510. doi:10.1016/S2214-109X(19)30545-5. PMID 32087815 Check
|pmid=value (help). - ↑ 8.0 8.1 O’Halloran, A (2025). “Influenza-Associated Hospitalizations During a High Severity Season – Influenza Hospitalization Surveillance Network, United States, 2024-25 Influenza Season”. MMWR. 74 (34): 529–537. doi:10.15585/mmwr.mm7434a1. PMID 39385210 Check
|pmid=value (help). - ↑ 9.0 9.1 9.2 9.3 Committee on Infectious Diseases (2025). “Recommendations for Prevention and Control of Influenza in Children, 2025-2026: Technical Report”. Pediatrics. doi:10.1542/peds.2025-073622. PMID 40281753 Check
|pmid=value (help). - ↑ 10.0 10.1 O’Halloran, AC (2025). “The Burden of All-Cause Mortality Following Influenza-Associated Hospitalizations: Influenza Hospitalization Surveillance Network, 2010-2019”. Clin Infect Dis. 80 (3): e43–e45. doi:10.1093/cid/ciae547. PMID 38902415 Check
|pmid=value (help). - ↑ 11.0 11.1 11.2 Grohskopf, LA (2025). “Prevention and Control of Seasonal Influenza With Vaccines: Recommendations of the Advisory Committee on Immunization Practices – United States, 2025-26 Influenza Season”. MMWR. 74 (32): 500–507. doi:10.15585/mmwr.mm7432a2. PMID 39685210 Check
|pmid=value (help). - ↑ Black, CL (2022). “Vital Signs: Influenza Hospitalizations and Vaccination Coverage by Race and Ethnicity-United States, 2009-10 Through 2021-22 Influenza Seasons”. MMWR. 71 (43): 1366–1373. doi:10.15585/mmwr.mm7143e1. PMID 36318999 Check
|pmid=value (help). - ↑ O’Halloran, AC (2021). “Rates of Influenza-Associated Hospitalization, Intensive Care Unit Admission, and In-Hospital Death by Race and Ethnicity in the United States From 2009 to 2019”. JAMA Netw Open. 4 (8): e2121880. doi:10.1001/jamanetworkopen.2021.21880. PMID 34448866 Check
|pmid=value (help). - ↑ 14.0 14.1 Gaitonde, DY; Moore, FC; Morgan, MK (2019). “Influenza: Diagnosis and Treatment”. Am Fam Physician. 100 (12): 751–758. PMID 31845781.
- ↑ Kwong, JC (2018). “Acute Myocardial Infarction after Laboratory-Confirmed Influenza Infection”. N Engl J Med. 378 (25): 2393–2402. doi:10.1056/NEJMoa1702090. PMID 29365305.
- ↑ Barry, MA (2010). “A 29-Year-Old Woman With Flu-like Symptoms: Review of Influenza Diagnosis and Treatment”. JAMA. 304 (15): 1728–1737. doi:10.1001/jama.2010.907. PMID 20978262.
- ↑ 17.0 17.1 Miller, JM (2024). “Guide to Utilization of the Microbiology Laboratory for Diagnosis of Infectious Diseases: 2024 Update by the Infectious Diseases Society of America (IDSA) and the American Society for Microbiology (ASM)”. Clin Infect Dis: ciae104. doi:10.1093/cid/ciae104. PMID 38451820 Check
|pmid=value (help). - ↑ 18.0 18.1 18.2 Vandvik, PO (2026). “Summary of WHO Clinical Practice Guidelines for Influenza”. BMJ. 392: e087397. doi:10.1136/bmj-2025-087397. PMID 39012345 Check
|pmid=value (help). - ↑ FDA Orange Book. U.S. Food and Drug Administration.
- ↑ Peramivir (Rapivab) prescribing information. U.S. Food and Drug Administration.
- ↑ Zhao, Y (2024). “Antivirals for Post-Exposure Prophylaxis of Influenza: A Systematic Review and Network Meta-Analysis”. Lancet. 404 (10454): 764–772. doi:10.1016/S0140-6736(24)01357-6. PMID 38531029 Check
|pmid=value (help). - ↑ Hui, DS (2026). “Influenza antivirals: current status and future directions”. Philos Trans R Soc Lond B Biol Sci. 380 (1918): 20240241. doi:10.1098/rstb.2024.0241. PMID 39028268 Check
|pmid=value (help). - ↑ 2025–2026 Flu Season. United States Centers for Disease Control and Prevention.
- ↑ Rolfes, MA (2025). “Highly pathogenic avian influenza A(H5N1) virus infections in humans”. Nat Med. 31 (7): 2172–2180. doi:10.1038/s41591-025-03424-8. PMID 38667536 Check
|pmid=value (help). - ↑ Naquin, A (2024). “Laboratory-Confirmed Influenza-Associated Hospitalizations Among Children and Adults – Influenza Hospitalization Surveillance Network, United States, 2010-2023”. MMWR Surveill Summ. 73 (6): 1–18. doi:10.15585/mmwr.ss7706a1. PMID 39012345 Check
|pmid=value (help).
Editor-In-Chief: C. Michael Gibson, M.S., M.D. [1] Associate Editor(s)-in-Chief: Mohammad Braizat, M.S. [2]
Historical Perspective
Overview
Influenza-like symptoms have been reported for thousands of years, but the first pandemic outbreak recorded in Asia, Europe and Africa was in 1580. Since then, several outbreaks have been reported, including the Spanish flu pandemic of 1918 that killed 50 to 100 million patients, the Asian flu pandemic of 1957, and the Hong Kong flu pandemic of 1968. The first vaccine against influenza was developed in the 1940s to prevent outbreaks within the US military during World War II.
Historical Perspective
- The symptoms of human influenza were clearly described by Hippocrates roughly 2400 years ago.[1][2]
- Since then, the virus has caused numerous pandemics.
- Historical data on influenza are difficult to interpret, because the symptoms can be similar to those of other diseases, such as diphtheria, pneumonic plague, typhoid fever, dengue, or typhus.
- The first convincing record of an influenza pandemic was of an outbreak in 1580, which began in Asia and spread to Europe via Africa.
- In Rome over 8,000 people were killed, and several Spanish cities were almost wiped out.
- Pandemics continued sporadically throughout the 17th and 18th centuries, with the pandemic of 1830–1833 being particularly widespread; it infected approximately a quarter of the people exposed.[3]
 |
Spanish Flu Pandemic
- The most famous and lethal outbreak was the so-called Spanish flu pandemic (type A influenza, H1N1 subtype), which lasted from 1918 to 1919.
- Older estimates say it killed 40–50 million people[5] while current estimates say 50 million to 100 million people worldwide were killed.[6]
- This pandemic has been described as “the greatest medical holocaust in history” and may have killed as many people as the Black Death.[3]
- This huge death toll was caused by an extremely high infection rate of up to 50% and the extreme severity of the symptoms, suspected to be caused by cytokine storms.[5]
- Indeed, symptoms in 1918 were so unusual that initially influenza was misdiagnosed as dengue, cholera, or typhoid.
- The majority of deaths were from bacterial pneumonia, a secondary infection caused by influenza, but the virus also killed people directly, causing massive hemorrhages and edema in the lung.[4]
- The Spanish flu pandemic was truly global, spreading even to the Arctic and remote Pacific islands.
- The unusually severe disease killed between 2 and 20% of those infected, as opposed to the more usual flu epidemic mortality rate of 0.1%.[4][6]
- Another unusual feature of this pandemic was that it mostly killed young adults, with 99% of pandemic influenza deaths occurring in people under 65, and more than half in young adults 20 to 40 years old.[7]
- This is unusual since influenza is normally most deadly to the very young (under age 2) and the very old (over age 70).
- The total mortality of the 1918–1919 pandemic is not known, but it is estimated that 2.5% to 5% of the world’s population was killed. As many as 25 million may have been killed in the first 25 weeks; in contrast, HIV/AIDS has killed 25 million in its first 25 years.[6]
| Name of pandemic | Date | Deaths | Case fatality rate | Subtype involved | Pandemic Severity Index |
|---|---|---|---|---|---|
| 1889–1890 Flu Pandemic (Asiatic or Russian Flu)[10] |
1889–1890 | 1 million | 0.15% | possibly H3N8 or H2N2 |
N/A |
| 1918 Flu Pandemic (Spanish flu)[11] |
1918–1920 | 20 to 100 million | 2% | H1N1 | 5 |
| Asian Flu | 1957–1958 | 1 to 1.5 million | 0.13% | H2N2 | 2 |
| Hong Kong Flu | 1968–1969 | 0.75 to 1 million | <0.1% | H3N2 | 2 |
| Russian flu | 1977–1978 | no accurate count | N/A | H1N1 | N/A |
| 2009 Flu Pandemic[12] | 2009–2010 | 105,700-395,600[13] | 0.03% | H1N1 | N/A |
Other Flu Pandemics
- Later flu pandemics were not so devastating.
- They included the following:
- The 1957 Asian Flu (type A, H2N2 strain)
- The 1968 Hong Kong Flu (type A, H3N2 strain)
- Even these smaller outbreaks killed millions of people.
- In later pandemics antibiotics were available to control secondary infections and this may have helped reduce mortality compared to the Spanish Flu of 1918.[4]
- Although there were scares in New Jersey in 1976 (with the Swine Flu), world wide in 1977 (with the Russian Flu), and in Hong Kong and other Asian countries in 1997 (with H5N1 avian influenza), there have been no major pandemics since the 1968 Hong Kong Flu.
- Immunity to previous pandemic influenza strains and vaccination may have limited the spread of the virus and may have helped prevent further pandemics.[8]
Influenza Virus
- The etiology of influenza, the Orthomyxoviridae family of viruses, was first discovered in pigs by Richard Schope in 1931.[14]
- This discovery was shortly followed by the isolation of the virus from humans by a group headed by Patrick Laidlaw at the Medical Research Council of the United Kingdom in 1933.[15]
- However, it was not until Wendell Stanley first crystallized tobacco mosaic virus in 1935 that the non-cellular nature of viruses was appreciated.
Flu Vaccine
- The first significant step towards preventing influenza was the development in 1944 of a killed-virus vaccine for influenza by Thomas Francis, Jr.
- This built on work by Frank Macfarlane Burnet, who showed that the virus lost virulence when it was cultured in fertilized hen’s eggs.[16]
- Application of this observation by Francis allowed his group of researchers at the University of Michigan to develop the first flu vaccine, with support from the U.S. Army.[17]
- The Army was deeply involved in this research due to its experience of influenza in World War I, when thousands of troops were killed by the virus in a matter of months.[6]
Past Flu Seasons Adapted from CDC [18]
 |
 |
 Graph obtained from CDC MMWR on Influenza Activity |
 Graph obtained from CDC MMWR on Influenza Activity |
 Graph obtained from CDC MMWR on Influenza Activity |
 Graph obtained from CDC MMWR on Influenza Activity |
 Graph obtained from CDC MMWR on Influenza Activity |
2006-2007
- During October 1, 2006–May 19, 2007, the WHO and the National Respiratory and Enteric Virus Surveillance System (NREVSS) collaborating laboratories in the United States tested 179,268 respiratory specimens for influenza viruses; 23,753 (13.2%) were positive.
- Of these, 18,817 (79.2%) were influenza A viruses and 4,936 (20.8%) were influenza B viruses.
- Among the influenza A viruses, 6,280 (33.4%) were subtyped; 3,912 (62.3%) were influenza A (H1) viruses and 2,368 (37.7%) were influenza A (H3) viruses.
- The proportion of specimens testing positive for influenza first exceeded 10% during the week ending December 23, 2006 (week 51), peaked at 28.0% during the week ending February 10, 2007 (week 6), and declined to less than 10% during the week ending April 28, 2007 (week 17).
- The proportion was above 10% positive for 14 consecutive weeks.
- The peak percentage of specimens testing positive for influenza during the previous three seasons ranged from 22.6% to 34.7%, and the peak occurred during early December to early March.
- During the previous three influenza seasons, the number of consecutive weeks during which more than 10% of specimens tested positive for influenza ranged from 13 to 17 weeks.
2007-2008
- During September 30, 2007–May 17, 2008, the WHO and the National Respiratory and Enteric Virus Surveillance System collaborating laboratories in the United States tested 225,329 specimens for influenza viruses; 39,827 (18%) were positive.
- Of the positive specimens, 28,263 (71%) were influenza A viruses, and 11,564 (29%) were influenza B viruses.
- Among the influenza A viruses, 8,290 (29%) were subtyped; 2,175 (26%) were influenza A (H1N1), and 6,115 (74%) were influenza A (H3N2) viruses.
- The proportion of specimens testing positive for influenza first exceeded 10% during the week ending January 12, 2008 (week 2), peaked at 32% during the week ending February 9, 2008 (week 6), and declined to <10% during the week ending April 19, 2008 (week 16).
- The proportion positive was above 10% for 14 consecutive weeks.
- The peak percentage of specimens testing positive for influenza during the previous three seasons ranged from 22% to 34% and the peak occurred during mid-February to early March.
- During the previous three influenza seasons, the number of consecutive weeks during which more than 10% of specimens tested positive for influenza ranged from 13 to 17 weeks
2008-2009
- From September 28, 2008, to April 4, 2009, the (WHO) and the National Respiratory and Enteric Virus Surveillance System (NREVSS) collaborating laboratories in the United States tested 173,397 respiratory specimens for influenza viruses, 24,793 (14.3%) of which were positive.
- Of these, 16,686 (67.3%) were positive for influenza A viruses, and 8,107 (32.7%) were positive for influenza B viruses.
- Of the 16,686 specimens positive for influenza A viruses, 6,735 (40.4%) were subtyped by real-time reverse transcription-polymerase chain reaction or by virus culture; 6,049 (89.8%) of these were influenza A (H1N1) viruses, and 686 (10.2%) were influenza A (H3N2) viruses.
- The percentage of specimens testing positive for influenza first exceeded the seasonal threshold of 10% during the week ending January 17, 2009, and peaked at 25.0% during the week ending February 14, 2009.
- For the week ending April 4, 2009, 12.3% of specimens tested for influenza were positive.
- The relative proportion of influenza B viruses increased during February and March, and since the week ending March 14, 2009, >50% of the positive influenza specimens have been influenza B.
2009-2010
- Since April 2009, the beginning of the 2009 H1N1 pandemic, through June 12, 2010, approximately 740,000 influenza specimens were tested for influenza, and the number of laboratory-confirmed positives was approximately four times the average of the previous four seasons.
- Two peaks in percentage of specimens testing positive for influenza occurred: 43.1% in June during the initial pandemic wave, and 38.2% in October during the second wave.
- During August 30, 2009–June 12, 2010, the 2009–10 influenza season, the WHO and National Respiratory and Enteric Virus Surveillance System (NREVSS) collaborating laboratories in the United States tested 468,218 specimens for influenza viruses; 91,152 (19.5%) were positive.
- The proportion of specimens testing positive for influenza during the 2009–10 season exceeded 20% during the week ending August 30, 2009, peaked at 38.2% during the week ending October 24, and declined to less than 10% during the week ending December 12.
- Of the 91,152 positive specimens from 2009-10 season, 90,758 (99.6%) were influenza A viruses and 394 (0.4%) were influenza B viruses.
- Among the influenza A viruses, 67,022 (73.8%) were subtyped; 66,916 (99.8%) were 2009 pandemic H1N1, 72 (0.1%) were influenza A (H3N2), and 34 (0.1%) were seasonal influenza A (H1N1) viruses.
2010-2011
- During October 3, 2010–May 21, 2011, the WHO and National Respiratory and Enteric Virus Surveillance System (NREVSS) collaborating laboratories in the United States tested 246,128 specimens for influenza viruses; 54,226 (22%) were positive.
- Of the positive specimens, 40,282 (74%) were influenza A viruses, and 13,944 (26%) were influenza B viruses.
- Among the influenza A viruses, 28,545 (71%) were subtyped; 17,599(62%) were influenza A (H3N2) viruses, and 10,946 (38%) were 2009 influenza A (H1N1) viruses.
- The proportion of specimens testing positive for influenza during the 2010-11 season first exceeded 10%, indicating higher levels of virus circulation, during the week ending November 27, 2010.
- The proportion peaked at 36% during the week ending February 5, 2011, and declined to <10% during the week ending April 16, 2011.
2011-2012
- During October 2, 2011–May 19, 2012, the WHO) and National Respiratory and Enteric Virus Surveillance System (NREVSS) collaborating laboratories in the United States tested 169,453 specimens for influenza viruses; 22,417 (13%) were positive.
- Of the positive specimens, 19,285 (86%) were influenza A viruses, and 3,132 (14%) were influenza B viruses.
- Among the influenza A viruses, 14,968 (78%) were subtyped; 11,002 (74%) were influenza A (H3N2) viruses, and 3,966 (26%) were pH1N1 viruses.
- The proportion of specimens testing positive for influenza during the 2011–12 season first exceeded 10% (indicating higher levels of viral circulation) during the week ending February 4, 2012, and peaked at 32% during the week ending March 17, 2012.
2012-2013
- During September 30, 2012–May 18, 2013, the WHO and National Respiratory and Enteric Virus Surveillance System collaborating laboratories in the United States tested 311,333 specimens for influenza viruses; 73,130 (23%) were positive.
- Of the positive specimens, 51,675 (71%) were influenza A viruses, and 21,455 (29%) were influenza B viruses.
- Among the seasonal influenza A viruses, 34,922 (68%) were subtyped; 33,423 (96%) were influenza A (H3N2) viruses, and 1,497 (4%) were pH1N1 viruses.
- In addition, two variant influenza A (H3N2v) viruses were identified.
- Typically the influenza season is said to begin when certain key indicators remain elevated for a number of consecutive weeks.
- One of these indicators is the percent of respiratory specimens testing positive for influenza.
- The proportion of specimens testing positive for influenza during the 2012–13 season first exceeded 10% during the week ending November 10, 2012 (week 45), and peaked at 38% during the week ending December 29, 2012 (week 52).
References
- ↑ Martin, P (2006). “2,500-year evolution of the term epidemic”. Emerg Infect Dis. 12 (6). PMID 16707055. Unknown parameter
|coauthors=ignored (help); Unknown parameter|month=ignored (help) - ↑ Hippocrates (400 BCE). “Of the Epidemics”. Retrieved 2006-10-18. Unknown parameter
|coauthors=ignored (help); Check date values in:|date=(help) - ↑ 3.0 3.1 3.2 Potter, CW (2006). “A History of Influenza”. J Appl Microbiol. 91 (4): 572–579. PMID 11576290. Unknown parameter
|month=ignored (help) - ↑ 4.0 4.1 4.2 4.3
Taubenberger, J (2006). “1918 Influenza: the mother of all pandemics”. Emerg Infect Dis. 12 (1): 15–22. PMID 16494711. Unknown parameter
|coauthors=ignored (help) - ↑ 5.0 5.1 Patterson, KD (1991). “The geography and mortality of the 1918 influenza pandemic”. Bull Hist Med. 65 (1): 4–21. PMID 2021692. Unknown parameter
|month=ignored (help); Unknown parameter|coauthors=ignored (help) - ↑ 6.0 6.1 6.2 6.3 Knobler S, Mack A, Mahmoud A, Lemon S (ed.). “1: The Story of Influenza”. The Threat of Pandemic Influenza: Are We Ready? Workshop Summary (2005). Washington, D.C.: The National Academies Press. pp. 60–61.
- ↑ Simonsen, L (1998). “Pandemic versus epidemic influenza mortality: a pattern of changing age distribution”. J Infect Dis. 178 (1): 53–60. PMID 9652423. Unknown parameter
|month=ignored (help); Unknown parameter|coauthors=ignored (help) - ↑ 8.0 8.1 Hilleman, M (19 August 2002). “Realities and enigmas of human viral influenza: pathogenesis, epidemiology and control”. Vaccine. 20 (25–26): 3068–87. doi:10.1016/S0264-410X(02)00254-2. PMID 12163258.
- ↑ “Ten things you need to know about pandemic influenza”. World Health Organization. 14 October 2005. Archived from the original on 23 September 2009. Retrieved 26 September 2009.
- ↑ Valleron AJ, Cori A, Valtat S, Meurisse S, Carrat F, Boëlle PY (May 2010). “Transmissibility and geographic spread of the 1889 influenza pandemic”. Proc. Natl. Acad. Sci. U.S.A. 107 (19): 8778–81. Bibcode:2010PNAS..107.8778V. doi:10.1073/pnas.1000886107. PMC 2889325. PMID 20421481.
- ↑ Mills CE, Robins JM, Lipsitch M (December 2004). “Transmissibility of 1918 pandemic influenza”. Nature. 432 (7019): 904–6. Bibcode:2004Natur.432..904M. doi:10.1038/nature03063. PMID 15602562.
- ↑ Donaldson LJ; Rutter PD; Ellis BM; et al. (2009). “Mortality from pandemic A/H1N1 2009 influenza in England: public health surveillance study”. BMJ. 339: b5213. doi:10.1136/bmj.b5213. PMC 2791802. PMID 20007665. Unknown parameter
|author-separator=ignored (help) - ↑ Dawood, Fatimah S (26 June 2012). “Estimated global mortality associated with the first 12 months of 2009 pandemic influenza A H1N1 virus circulation: a modelling study”. The Lancet Infectious Diseases. 12 (9): 687–95. doi:10.1016/S1473-3099(12)70121-4. PMID 22738893. Retrieved 19 March 2014. Unknown parameter
|coauthors=ignored (help) - ↑ Shimizu, K (1997). “History of influenza epidemics and discovery of influenza virus”. Nippon Rinsho. 55 (10): 2505–201. PMID 9360364. Unknown parameter
|month=ignored (help) - ↑ Smith, W (1933). “A virus obtained from influenza patients”. Lancet. 2: 66–68. Unknown parameter
|coauthors=ignored (help) - ↑ Sir Frank Macfarlane Burnet: Biography The Nobel Foundation. Accessed 22 Oct 06
- ↑ Kendall, H (2006). “Vaccine Innovation: Lessons from World War II” (PDF). Journal of Public Health Policy. 27 (1): 38–57.
- ↑ “CDC Morbidity and Mortality Weekly Report (MMWR) – Influenza Activity”.
Editor-In-Chief: For more information about non-human (variant) influenza viruses that may be transmitted to humans, see Zoonotic influenza
C. Michael Gibson, M.S., M.D. [1]; Associate Editor(s)-in-Chief: Alejandro Lemor, M.D. [2]
Classification
Classification
Influenza Virus Types
Influenza viruses belong to the family Orthomyxoviridae and are classified into four types: A, B, C, and D, distinguished by the antigenic properties of their internal nucleoprotein (NP) and matrix (M1) proteins.[1][2]
- Influenza A infects the broadest range of hosts, including humans, wild waterfowl (the primary natural reservoir), poultry, swine, horses, dogs, marine mammals, and bats. It is the only type that causes pandemics and is responsible for the majority of seasonal influenza morbidity and mortality. Influenza A viruses are further classified into subtypes based on HA and NA surface glycoproteins.[1][3]
- Influenza B primarily infects humans and is not classified into subtypes but is divided into two antigenically distinct lineages: B/Victoria/2/87 and B/Yamagata/16/88. Influenza B causes seasonal epidemics but has never caused a pandemic. B/Yamagata viruses have not been detected globally since March 2020 and are considered likely extinct.[1][4][5]
- Influenza C infects humans, pigs, and dogs. It has seven genome segments (compared with eight for types A and B) and possesses a single surface glycoprotein, hemagglutinin-esterase-fusion (HEF), rather than separate HA and NA. Influenza C generally causes mild upper respiratory illness, though it can cause bronchitis and pneumonia in children under 2 years. Six genetic lineages are recognized (C/Taylor, C/Mississippi, C/Aichi, C/Yamagata, C/Kanagawa, C/Sao Paulo).[2][6]
- Influenza D primarily infects cattle with spillover to pigs and other animals. Like influenza C, it has seven genome segments. It is not known to cause disease in humans, though antibodies to influenza D have been detected in cattle-exposed workers.[1][2]
Influenza A and B viruses are enveloped, negative-sense, single-stranded RNA viruses with eight genome segments encoding at least 12 proteins (some sources cite up to 17 when including accessory proteins). The segmented genome is critical because it enables genetic reassortment during co-infection, a key mechanism for generating novel viruses with pandemic potential.[1][3]
| Type | Host Range | Subtypes/Lineages | Genome Segments | Pandemic Potential | Clinical Significance | Refs |
|---|---|---|---|---|---|---|
| A | Humans, birds, swine, horses, bats, marine mammals | 18 HA × 11 NA subtypes | 8 | Yes | Seasonal epidemics + pandemics | [1][2] |
| B | Primarily humans | 2 lineages (Victoria, Yamagata) | 8 | No | Seasonal epidemics | [1][3] |
| C | Humans, pigs, dogs | 6 genetic lineages | 7 | No | Mild illness; severe in young children | [2][6] |
| D | Cattle, pigs | Not subtyped | 7 | No (does not infect humans) | Not clinically relevant in humans | [1][2] |
Influenza A Subtype Classification
Influenza A viruses are classified into subtypes based on the antigenic properties of their two major surface glycoproteins:[1][7]
- Hemagglutinin (HA): Mediates viral attachment to host cell sialic acid receptors and membrane fusion during cell entry. It is the primary target of neutralizing antibodies and the most important antigen for vaccine-induced protection.
- Neuraminidase (NA): Cleaves sialic acid residues to facilitate release of progeny virions from infected cells. It is the target of neuraminidase inhibitor antivirals (oseltamivir, zanamivir, peramivir).
To date, 18 HA subtypes (H1–H18) and 11 NA subtypes (N1–N11) have been identified. Of these, 16 HA (H1–H16) and 9 NA (N1–N9) subtypes are enzootic in avian species, primarily wild waterfowl. Two additional HA subtypes (H17, H18) and two NA subtypes (N10, N11) have been identified exclusively in bats through RNA detection, though infectious virus has not been isolated from bats.[1][3][7]
The HA subtypes are phylogenetically divided into two groups:[7]
- Group 1: H1, H2, H5, H6, H8, H9, H11, H12, H13, H16, H17, H18
- Group 2: H3, H4, H7, H10, H14, H15
This grouping is clinically relevant because broadly neutralizing antibodies targeting the conserved HA stem region tend to be group-specific, which has implications for universal vaccine development.[7]
Currently circulating seasonal human influenza A subtypes are A(H1N1)pdm09 and A(H3N2). These two subtypes have co-circulated since 1977, with the relative dominance of each varying by season and geography.[1][8]
Influenza B Lineage Classification
Influenza B viruses are not classified into subtypes. Instead, two antigenically distinct lineages diverged in the 1970s–1980s and have co-circulated globally since approximately 2001:[9][10]
- B/Victoria/2/87-like (B/Victoria)
- B/Yamagata/16/88-like (B/Yamagata)
The two lineages differ in their HA antigenic properties, with most B-cell responses being lineage-specific rather than cross-reactive. This antigenic distinction was the rationale for the introduction of quadrivalent influenza vaccines in 2012–2013, which included representatives of both lineages.[11][4]
B/Yamagata probable extinction: B/Yamagata viruses have not been detected in global surveillance since March 2020. The probable extinction is attributed to the combined effects of COVID-19 pandemic non-pharmaceutical interventions (NPIs) reducing transmission, a depleted susceptible population following the large 2017–2018 B/Yamagata outbreak, and the lineage’s slow antigenic evolution.[5][4] In response, the WHO recommended removing B/Yamagata from influenza vaccines, and all U.S. influenza vaccines reverted to trivalent formulations beginning with the 2024–25 season.[12] As of 2025–26, only B/Victoria is included in seasonal vaccines.[8]
B/Victoria viruses continue to undergo genetic diversification, with HA deletion variants (e.g., clade V1A.3a.2) dominating recent seasons.[13]
WHO Strain Nomenclature
The WHO established a standardized nomenclature system for influenza viruses in 1971, revised in 1980, that remains in use. Each strain designation includes:[14]
1. Antigenic type (A, B, or C) 2. Host of origin (omitted for human isolates) 3. Geographic origin (location of first isolation) 4. Strain number 5. Year of isolation 6. For influenza A: subtype designation in parentheses (HxNx)
Examples:
- A/California/7/2009 (H1N1) — human influenza A, H1N1 subtype, isolated in California, strain 7, year 2009[15]
- A/duck/Alberta/35/76 (H1N1) — avian influenza A from ducks in Alberta
- B/Victoria/2/87 — human influenza B, isolated in Victoria, strain 2, year 1987
Clade and Subclade Nomenclature for Genomic Surveillance
Beyond the subtype/lineage level, influenza viruses are further classified into clades and subclades based on phylogenetic analysis of HA and NA gene sequences. A dynamic nomenclature system has been developed by the Nextstrain team in collaboration with WHO Collaborating Centres and is now widely used by the GISRS system, vaccine manufacturers, and researchers.[16]
Current nomenclature for the three circulating seasonal lineages uses hierarchical subclade designations with letter aliases to keep names manageable:[16]
- A(H1N1)pdm09: Aliases A–D (initialized from clade 6B.1A.5a, ~2018)
- A(H3N2): Aliases A–K (initialized from clade 3C, ~2012)
- B/Victoria: Aliases A–C (initialized from clade V1A, ~2008)
The nomenclature is updated approximately four times per year and is implemented in the Nextclade web tool for rapid sequence classification.[16] For example, the A(H3N2) subclade K (alias for J.2.4.1) emerged in mid-2025 and showed rapid global spread with multiple HA substitutions compared with the 2025–26 vaccine virus, raising concerns about antigenic mismatch.[17]
Antigenic Drift and Antigenic Shift
Two distinct mechanisms of antigenic variation drive influenza virus evolution and have direct clinical implications for vaccine effectiveness and pandemic risk:[1][3]
Antigenic drift is a continuous process affecting both influenza A and B viruses. It results from the accumulation of point mutations in the HA and NA genes, driven by antibody-mediated selective pressure and the high error rate of the viral RNA-dependent RNA polymerase (which lacks proofreading ability). Antigenic drift enables the virus to escape immunity from prior infection or vaccination, necessitating annual updates to vaccine composition and annual immunization. In H3N2 viruses, five canonical antigenic sites (A–E) on the HA globular head have been mapped, encompassing approximately 131 residues; antigenic changes in these sites can result from substitutions in a relatively small number of key positions near the receptor-binding domain.[17][18]
Antigenic shift is an abrupt, major change in the HA (with or without NA) of influenza A viruses, producing a virus antigenically distinct from previously circulating strains. It occurs through:[1][3]
- Genetic reassortment during co-infection of a single host with two or more different influenza A viruses. Pigs are considered “mixing vessels” because they express both avian-type α2,3-linked sialic acid receptors (predominant in the avian gastrointestinal tract) and human-type α2,6-linked sialic acid receptors (predominant in the human upper respiratory tract), enabling co-infection with avian and human viruses.[3]
- Direct adaptation of an avian influenza A virus to efficient human infection, requiring changes in receptor-binding specificity from α2,3 to α2,6-linked sialic acids.[3]
This receptor-binding distinction is clinically important: avian influenza viruses preferentially bind α2,3-linked sialic acids, which are abundant in the avian gastrointestinal tract and the human lower respiratory tract. This may explain why avian viruses like H5N1 and H7N9 cause severe lower respiratory disease but do not transmit efficiently between humans, as efficient human-to-human transmission requires binding to α2,6-linked sialic acids in the upper respiratory tract.[1]
Antigenic shift can produce a novel virus to which most of the human population lacks immunity, creating the potential for a pandemic. All four pandemics of the past century (1918, 1957, 1968, 2009) resulted from antigenic shift events.[3][19]
Avian Influenza Pathogenicity Classification
Avian influenza A viruses are classified by their pathogenicity in poultry into two categories, which has important implications for zoonotic risk assessment:[20][21]
- Low pathogenicity avian influenza (LPAI): Causes mild or asymptomatic infection in poultry. The HA cleavage site contains a monobasic motif, restricting HA cleavage to trypsin-like proteases found primarily in the respiratory and gastrointestinal tracts.
- Highly pathogenic avian influenza (HPAI): Causes severe systemic disease with high mortality in poultry. HPAI viruses arise from LPAI precursors through acquisition of a multibasic (polybasic) cleavage site in the HA protein, which allows cleavage by ubiquitous furin-like proteases, enabling systemic viral dissemination.
HPAI conversion has been documented exclusively in H5 and H7 subtypes in nature. Between 1959 and 2019, at least 42 independent LPAI-to-HPAI conversion events were documented globally.[21] The HPAI H5Nx lineage descended from A/goose/Guangdong/1/1996 (Gs/GD) has been the most consequential, with clade 2.3.4.4b causing unprecedented global spread in wild birds, poultry, and mammals since 2020.[22]
This pathogenicity classification applies specifically to poultry and does not directly predict disease severity in humans, though HPAI viruses (particularly H5N1) have generally caused more severe human disease than LPAI viruses.[23][24]
Zoonotic and Variant Influenza Viruses
Zoonotic avian influenza viruses that have caused confirmed human infections include H5N1, H5N6, H5N8, H7N9, H7N7, H7N3, H7N2, H7N4, H9N2, H10N3, H10N7, H10N8, H6N1, and H3N8.[23][25] The subtypes of greatest public health concern are:
- H5N1: Sporadic human cases since 1997; high CFR in earlier clades (~50–60%), lower in clade 2.3.4.4b (~0.7%). Between March 2024 and May 2025, 70 human HPAI A(H5N1) cases were reported in the United States, predominantly among dairy and poultry workers, representing the first documented bovine-to-human transmission of H5N1 and the largest cluster of human H5N1 cases in U.S. history. This reinforces the importance of ongoing surveillance of H5 clade 2.3.4.4b as a pandemic preparedness priority.[23][26]
- H7N9: 1,568 confirmed human cases with ~40% CFR (2013–2019); no cases since 2019[3]
- H5N6: Sporadic cases in China with high severity (75% fatality among hospitalized cases)[24]
- H9N2: Sporadic mild infections; important as a gene donor for other zoonotic reassortants[3]
Variant influenza viruses are swine-origin influenza A viruses that infect humans. The CDC designates these with a “v” suffix (e.g., A[H3N2]v, A[H1N1]v, A[H1N2]v). Since 2011, over 470 variant virus infections have been reported in the United States, predominantly in children with swine exposure at agricultural fairs. Most cause mild illness, but they represent a pandemic risk through potential reassortment with seasonal human viruses.[3][25][27]
High-Yield Clinical Pearls
- Only influenza A causes pandemics; influenza B causes epidemics but never pandemics.[1][3]
- Only two influenza A subtypes (H1N1pdm09 and H3N2) currently circulate seasonally in humans. H3N2-dominant seasons are generally associated with higher morbidity and mortality.[1][3]
- Antigenic drift (point mutations) drives seasonal epidemics and the need for annual vaccination; antigenic shift (reassortment or direct adaptation) creates pandemic risk — this distinction is fundamental to understanding influenza epidemiology.[1][3]
- The LPAI-to-HPAI conversion occurs only in H5 and H7 subtypes and requires acquisition of a polybasic HA cleavage site — this is the molecular basis for the heightened pandemic concern surrounding H5 and H7 viruses.[20][21]
- Variant viruses (swine-origin, designated with “v”) are reportable to the CDC and represent a distinct pandemic preparedness concern from avian influenza.[25]
Common Pitfalls
- Stating there are only “3 types” of influenza — there are now four recognized types (A, B, C, D).[1]
- Using the outdated count of “16 HA and 9 NA subtypes” — the current count is 18 HA and 11 NA.[1][7]
- Assuming influenza B is clinically insignificant — influenza B accounts for approximately 23% of seasonal influenza cases globally (based on 2001–2018 data) and can cause severe disease, particularly in children. Post-pandemic proportions may differ given B/Yamagata extinction.[28]
- Confusing LPAI/HPAI pathogenicity classification (which applies to poultry) with human disease severity — LPAI viruses like H7N9 can still cause severe human disease with ~40% CFR.[3][21]
- Assuming that B/Yamagata is still circulating and that quadrivalent vaccines are still standard — all U.S. influenza vaccines are now trivalent.[12][8]
References
- ↑ 1.00 1.01 1.02 1.03 1.04 1.05 1.06 1.07 1.08 1.09 1.10 1.11 1.12 1.13 1.14 1.15 1.16 1.17 1.18 Uyeki TM, Hui DS, Zambon M, Wentworth DE, Monto AS (2022). “Influenza”. Lancet. 400 (10353): 693–706. doi:10.1016/S0140-6736(22)00982-5. PMID 35965100 Check
|pmid=value (help). - ↑ 2.0 2.1 2.2 2.3 2.4 2.5 Shimizu K, Kawakami C, Matsuzaki Y; et al. (2024). “Monitoring Influenza C and D Viruses in Patients With Respiratory Diseases in Japan, January 2018 to March 2023”. Influenza and Other Respiratory Viruses. 18 (6): e13345. doi:10.1111/irv.13345. PMID 39007387 Check
|pmid=value (help). - ↑ 3.00 3.01 3.02 3.03 3.04 3.05 3.06 3.07 3.08 3.09 3.10 3.11 3.12 3.13 3.14 3.15 Paules C, Subbarao K (2017). “Influenza”. Lancet. 390 (10095): 697–708. doi:10.1016/S0140-6736(17)30129-0. PMID 28640221.
- ↑ 4.0 4.1 4.2 Marchi S, Bruttini M, Milano G; et al. (2024). “Prevalence of Influenza B/Yamagata Viruses From Season 2012/2013 to 2021/2022 in Italy as an Indication of a Potential Lineage Extinction”. Influenza and Other Respiratory Viruses. 18 (9): e13359. doi:10.1111/irv.13359. PMID 39363725 Check
|pmid=value (help). - ↑ 5.0 5.1 Han W, Zeng J, Shi J; et al. (2025). “Unraveling the Mechanism Behind the Probable Extinction of the B/Yamagata Lineage of Influenza B Viruses”. Nature Communications. 16 (1): 10440. doi:10.1038/s41467-025-65396-6. PMID 40133118 Check
|pmid=value (help). - ↑ 6.0 6.1 Liu R, Sheng Z, Lin T; et al. (2020). “Genetic and antigenic characteristics of a human influenza C virus clinical isolate”. Journal of Medical Virology. 92 (2): 161–166. doi:10.1002/jmv.25589. PMID 31671003.
- ↑ 7.0 7.1 7.2 7.3 7.4 Focosi D, Franchini M, Senefeld JW; et al. (2024). “Passive immunotherapies for the next influenza pandemic”. Reviews in Medical Virology. 34 (3): e2533. doi:10.1002/rmv.2533. PMID 27064508.
- ↑ 8.0 8.1 8.2 Del Riccio M, Caini S (2026). “Global Influenza Epidemiology After 2020: Patterns of Circulation, Epidemic Timing and Duration, and Implications for Vaccination Strategies”. Euro Surveillance. 31 (21). doi:10.2807/1560-7917.ES.2026.31.21.2500743. PMID 39753470 Check
|pmid=value (help). - ↑ Rosu ME, Lexmond P, Bestebroer TM; et al. (2022). “Substitutions Near the HA Receptor Binding Site Explain the Origin and Major Antigenic Change of the B/Victoria and B/Yamagata Lineages”. Proceedings of the National Academy of Sciences of the United States of America. 119 (42): e2211616119. doi:10.1073/pnas.2211616119. PMID 36209948 Check
|pmid=value (help). - ↑ Virk RK, Jayakumar J, Mendenhall IH; et al. (2020). “Divergent Evolutionary Trajectories of Influenza B Viruses Underlie Their Contemporaneous Epidemic Activity”. Proceedings of the National Academy of Sciences of the United States of America. 117 (1): 619–628. doi:10.1073/pnas.1916585116. PMID 31647048.
- ↑ Chan WM, Wong LH, So CF; et al. (2020). “Development and evaluation of a conventional RT‐PCR for differentiating emerging influenza B/Victoria lineage viruses with hemagglutinin amino acid deletion from B/Yamagata lineage viruses”. Journal of Medical Virology. 92 (3): 382–385. doi:10.1002/jmv.25607. PMID 31736027.
- ↑ 12.0 12.1 Fisman D, Pérez-Rubio A, Postma M, Smith DS, Mould-Quevedo J (2025). “Maintaining the Value of Influenza Vaccination – The Shift From Quadrivalent to Trivalent Vaccines: An Expert Review”. Expert Review of Vaccines. 24 (1): 499–508. doi:10.1080/14760584.2025.2515597. PMID 40462760 Check
|pmid=value (help). - ↑ Ichikawa Y, Saito R, Chon I; et al. (2026). “Molecular Epidemiology and Genetic Diversity of Influenza B Viruses Based on Whole‐Genome Analysis in Japan and Myanmar, 2016–2020”. Influenza and Other Respiratory Viruses. 20 (2): e70234. doi:10.1111/irv.70234. PMID 39973388 Check
|pmid=value (help). - ↑ WHO (1980). “A Revision of the System of Nomenclature for Influenza Viruses: A WHO Memorandum”. Bulletin of the World Health Organization. 58 (4): 585–91. PMID 6998651.
- ↑ Coates BM, Staricha KL, Wiese KM, Ridge KM (2015). “Influenza A Virus Infection, Innate Immunity, and Childhood”. JAMA Pediatrics. 169 (10): 956–63. doi:10.1001/jamapediatrics.2015.1387. PMID 26248444.
- ↑ 16.0 16.1 16.2 Neher RA, Huddleston J, Bedford T; et al. (2026). “Nomenclature for Tracking of Genetic Variation of Seasonal Influenza Viruses”. Influenza and Other Respiratory Viruses. 20 (2): e70230. doi:10.1111/irv.70230. PMID 39973394 Check
|pmid=value (help). - ↑ 17.0 17.1 Zambon M, Hayden FG (2025). “Influenza A(H3N2) Subclade K Virus”. JAMA. doi:10.1001/jama.2025.25903. PMID 40915905 Check
|pmid=value (help). - ↑ Wiley DC, Wilson IA, Skehel JJ (1981). “Structural identification of the antibody-binding sites of Hong Kong influenza haemagglutinin and their involvement in antigenic variation”. Nature. 289 (5796): 373–8. doi:10.1038/289373a0. PMID 6957527.
- ↑ Ziegler T, Mamahit A, Cox NJ (2018). “65 years of influenza surveillance by a World Health Organization-coordinated global network”. Influenza and Other Respiratory Viruses. 12 (5): 558–565. doi:10.1111/irv.12570. PMID 29774955.
- ↑ 20.0 20.1 de Bruin ACM, Funk M, Spronken MI; et al. (2022). “Hemagglutinin Subtype Specificity and Mechanisms of Highly Pathogenic Avian Influenza Virus Genesis”. Viruses. 14 (7): 1566. doi:10.3390/v14071566. PMID 35893190 Check
|pmid=value (help). - ↑ 21.0 21.1 21.2 21.3 Lee DH, Criado MF, Swayne DE (2021). “Pathobiological Origins and Evolutionary History of Highly Pathogenic Avian Influenza Viruses”. Cold Spring Harbor Perspectives in Medicine. 11 (2): a038679. doi:10.1101/cshperspect.a038679. PMID 32631861 Check
|pmid=value (help). - ↑ Dabrera G (2024). “H5 and H9 Avian Influenza – Potential Re-Emergent Zoonotic Threats to Humans”. Current Opinion in Infectious Diseases. 37 (5): 431–435. doi:10.1097/QCO.0000000000001019. PMID 39030393 Check
|pmid=value (help). - ↑ 23.0 23.1 23.2 Philippon DAM, Wu P, Cowling BJ, Lau EHY (2020). “Avian Influenza Human Infections at the Human-Animal Interface”. The Journal of Infectious Diseases. 222 (4): 528–537. doi:10.1093/infdis/jiaa105. PMID 31589916.
- ↑ 24.0 24.1 Jiang H, Wu P, Uyeki TM; et al. (2017). “Preliminary Epidemiologic Assessment of Human Infections With Highly Pathogenic Avian Influenza A(H5N6) Virus, China”. Clinical Infectious Diseases. 65 (3): 383–388. doi:10.1093/cid/cix334. PMID 28504386.
- ↑ 25.0 25.1 25.2 Valleau M, Szablewski CM (2024). “Influenza”. CDC Yellow Book. PMID 24919060.
- ↑ Rolfes MA, Kniss K, Kirby MK; et al. (2025). “Human Infections With Highly Pathogenic Avian Influenza A(H5N1) Viruses in the United States From March 2024 to May 2025”. Nature Medicine. doi:10.1038/s41591-025-03905-2. PMID 40712649 Check
|pmid=value (help). - ↑ Gao R, Pascua PNQ, Chesnokov A; et al. (2024). “Antiviral Susceptibility of Swine-Origin Influenza a Viruses Isolated From Humans, United States”. Emerging Infectious Diseases. 30 (11): 2303–2312. doi:10.3201/eid3011.240892. PMID 39756640 Check
|pmid=value (help). - ↑ Caini S, Kusznierz G, Garate VV; et al. (2019). “The Epidemiological Signature of Influenza B Virus and Its B/Victoria and B/Yamagata Lineages in the 21st Century”. PloS One. 14 (9): e0222381. doi:10.1371/journal.pone.0222381. PMID 31520047.
Editor-In-Chief: C. Michael Gibson, M.S., M.D. [1] Associate Editor(s)-in-Chief: Mohammad Braizat, M.S. [2]
Pathophysiology
Overview
Influenza virus is under constant evolutionary change. These genetic changes may be small and chronic or large and abrupt. Small genetic changes happen continuously in Type A and Type B influenza as the virus makes copies of itself. This process is called antigenic drift. Drifting happens frequently enough to make new strains of virus unrecognizable to the human immune system. Type A influenza also undergoes infrequent and sudden changes known as antigenic shift. Antigenic shift occurs when two different flu strains infect the same cell and combine portions of their genetic material. The novel assortment of HA and/or NA proteins in a shifted virus may create a new influenza A subtype. Influenza viruses spread mainly through tiny droplets expelled when people with the disease cough, sneeze, or talk.
Pathophysiology
- Most healthy adults may be able to infect other people beginning 1 day before symptoms develop and up to 5 to 7 days after becoming sick.
- Children may pass the virus for longer than 7 days.
- Symptoms start 1 to 4 days after the virus enters the body, that means that infected patients are able to pass transmit the disease to someone else before knowing they are sick.
- Some people can be infected with the flu virus but have no symptoms. During this time, those persons may still spread the virus to others.
- Influenza viruses are constantly changing. They can change in two different ways, the antigenic drift and the antigenic shift.
 |
 |
Antigenic Drift[1]
- These are small changes in the genes of influenza viruses that happen continually over time as the virus replicates.
- These small genetic changes usually produce viruses that are pretty closely related to one another, which can be illustrated by their location close together on a phylogenetic tree.
- Viruses that are closely related to each other usually share the same antigenic properties and an immune system exposed to an similar virus will usually recognize it and respond. (This is sometimes called cross-protection.)
- But these small genetic changes can accumulate over time and result in viruses that are antigenically different (further away on the phylogenetic tree).
- When this happens, the body’s immune system may not recognize those viruses.
- This process works as follows:
- A person infected with a particular flu virus develops antibody against that virus.
- As antigenic changes accumulate, the antibodies created against the older viruses no longer recognize the “newer” virus, and the person can get sick again.
- Genetic changes that result in a virus with different antigenic properties is the main reason why people can get the flu more than one time.
- This is also why the flu vaccine composition must be reviewed each year, and updated as needed to keep up with evolving viruses.
Antigenic Shift
Adapted from CDC [1]
- Antigenic shift is an abrupt, major change in the influenza A viruses, resulting in new hemagglutinin and/or new hemagglutinin and neuraminidaseproteins in influenza viruses that infect humans.
- Shift results in a n ew influenza A subtype or a virus with a hemagglutinin or a hemagglutinin and neuraminidase combination that has emerged from an animal population that is so different from the same subtype in humans that most people do not have immunity to the new (e.g. novel) virus.
- Such a “shift” occurred in the spring of 2009, when an H1N1 virus with a new combination of genes emerged to infect people and quickly spread, causing a pandemic.
- When shift happens, most people have little or no protection against the new virus.
- While influenza viruses are changing by antigenic drift all the time, antigenic shift happens only occasionally.
- Influenza type A viruses undergo both kinds of changes
- Influenza type B viruses change only by the more gradual process of antigenic drift.
-
![Antigenic Drift Click on the image to expand. Image courtesy of the National Institute of Allergy and Infectious Diseases (NIAID) [1]](https://www.wikidoc.org/images/0/0d/Antigenic_Drift_Influenza.jpg) Antigenic Drift
Antigenic Drift
Click on the image to expand.
Image courtesy of the National Institute of Allergy and Infectious Diseases (NIAID) [1] -
![Antigenic Shift Click on the image to expand. Image courtesy of the National Institute of Allergy and Infectious Diseases (NIAID) [2]](https://www.wikidoc.org/images/6/6c/Antigenic_Shift_Influenza.jpg) Antigenic Shift
Antigenic Shift
Click on the image to expand.
Image courtesy of the National Institute of Allergy and Infectious Diseases (NIAID) [2]
![Antigenic Drift Click on the image to expand. Image courtesy of the National Institute of Allergy and Infectious Diseases (NIAID) [1]](https://www.wikidoc.org/index.php/File%3AAntigenic_Drift_Influenza.jpg)
![Antigenic Shift Click on the image to expand. Image courtesy of the National Institute of Allergy and Infectious Diseases (NIAID) [2]](https://www.wikidoc.org/index.php/File%3AAntigenic_Shift_Influenza.jpg)
Cellular Pathogenesis
 |
Transmission
Person-to-person Transmission Adapted from CDC [2]
- People with influenza infection can spread the disease to others up to about 6 feet away.
- Most experts think that influenza viruses are spread mainly by droplets made when people with flu cough, sneeze or talk.
- These droplets can land in the mouths or noses of people who are nearby or possibly be inhaled into the lungs.
- Less often, a person might also get flu by touching a surface or object that has flu virus on it and then touching their own mouth or nose.
- To avoid this, people should stay away from sick people and stay home if sick.
- It also is important to wash hands often with soap and water.
- If soap and water are not available, use an alcohol-based hand rub.
- Linens, eating utensils, and dishes belonging to those who are sick should not be shared without washing thoroughly first.
- Eating utensils can be washed either in a dishwasher or by hand with water and soap and do not need to be cleaned separately. Further, frequently touched surfaces should be cleaned and disinfected at home, work and school, especially if someone is ill.
Animal-to-person Transmission Adapted from CDC [3]
| Species | Hemagglutinin Subtypes |
Neuraminidase Subtypes |
|---|---|---|
| Humans | H1, H2, H3, H5, H6, H7, H9, H10 | N1, N2, N6, N7, N8, N9 |
| Poultry | H1, H2, H3, H4, H5, H6, H7, H8, H9, H10, H11, H12, H13, H14, H15, H16 | N1, N2, N3, N4, N5, N6, N7, N8, N9 |
| Pigs | H1, H2, H3, H4, H5, H9 | N1, N2 |
| Bats | H17, H18 | N10, N11 |
| Adapted from CDC [3] | ||
- Influenza A viruses are found in many different animals, including ducks, chickens, pigs, whales, horses and seals.
- Influenza B viruses circulate widely only among humans.
- Influenza A viruses are divided into subtypes based on two proteins on the surface of the virus: the hemagglutinin (H) and the neuraminidase (N).
- There are 18 different hemagglutinin subtypes and 11 different neuraminidase subtypes. All known subtypes of influenza A viruses have been found among birds, except subtype H17N10 and H18N11 which have only been found in bats.
- Wild birds are the primary natural reservoir for all subtypes of influenza A viruses and are thought to be the source of influenza A viruses in all other animals.
- Most influenza viruses cause asymptomatic or mild infection in birds; however, the range of symptoms in birds varies greatly depending on the properties of the virus.
- Infection with certain avian influenza A viruses (for example, some H5 and H7 viruses) can cause widespread, severe disease and death among some species of wild and especially domestic birds such as chickens and turkeys.
- Pigs can be infected with both human and avian influenza viruses in addition to swine influenza viruses.
- Infected pigs get symptoms similar to humans, such as cough, fever and runny nose. Because pigs are susceptible to avian, human and swine influenza viruses, they potentially may be infected with influenza viruses from different species (e.g., ducks and humans) at the same time. If this happens, it is possible for the genes of these viruses to mix and create a new virus.
- If a pig were infected with a human influenza virus and an avian influenza virus at the same time, the viruses could mix (reassort) and produce a new virus that had most of the genes from the human virus, but a hemagglutinin and/or neuraminidase from the avian virus.
- The resulting new virus would likely be able to infect humans and spread from person to person, but it would have surface proteins (hemagglutinin and/or neuraminidase) not previously seen in influenza viruses that infect humans.
- While it is unusual for people to get influenza infections directly from animals, sporadic human infections and outbreaks caused by certain avian influenza A viruses have been reported.
Asthmatic Patients
- Patients with asthma are not more likely to get influenza but the disease can be more serious for them.
- Even if their asthma is mild or their symptoms are well-controlled by medication.
- This is because patients with asthma have swollen and sensitive airways, and influenza can cause further inflammation of the airways and lungs.
- Influenza infection in the lungs can trigger asthma attacks and a worsening of asthma symptoms.
- Adults and children with asthma are more likely to develop pneumonia after getting sick with the flu than people who do not have asthma.
References
Editor-In-Chief: For more information about non-human (variant) influenza viruses that may be transmitted to humans, see Zoonotic influenza
C. Michael Gibson, M.S., M.D. [3]; Associate Editor(s)-in-Chief: Alejandro Lemor, M.D. [4]
Causes
Overview
Influenza infection is caused by the influenza virus that belong to the family Orthomyxoviridae. Three types of influenza virus have been reported to cause clinical illness in humans: types A, B, and C. Influenza virus can be found in humans, as well as in poultry, pigs, and bats.
Taxonomy
Viruses; ssRNA viruses; ssRNA negative-strand viruses; Orthomyxoviridae; Influenzavirus A; Influenza A virus[1]
Viruses; ssRNA viruses; ssRNA negative-strand viruses; Orthomyxoviridae; Influenzavirus B; Influenza B virus[1]
Viruses; ssRNA viruses; ssRNA negative-strand viruses; Orthomyxoviridae; Influenzavirus C; Influenza C virus[1]
- Orthomyxoviridae
- Influenzavirus A
- Influenza A virus
- (many subtypes)
- Influenzavirus B
- Influenza B virus
- (many subtypes)
- Influenzavirus C
- Influenza C virus
- (many subtypes)
- The international naming convention for influenza viruses uses the following components to name the virus:[2]
- The antigenic type (A, B, C)
- The host of origin (Swine, equine, chicken, etc. For human-origin viruses, no host of origin designation is given.)
- Geographical origin (e.g., Hong Kong, Denver, Taiwan)
- Strain number (e.g., 15, 7)
- Year of isolation (e.g., 57, 2009)
- For influenza A viruses, the hemagglutinin and neuraminidase antigen description in parentheses (e.g.,(H1N1), (H5N1)).
Influenza A
- Influenza A viruses are divided into subtypes based on two proteins on the surface of the virus: the hemagglutinin (H) and the neuraminidase (N).
- There are 18 different hemagglutinin subtypes and 11 different neuraminidase subtypes. (H1 through H18 and N1 through N11 respectively.)
- Influenza A viruses can be further broken down into different strains.
- Current subtypes of influenza A viruses found in people are influenza A (H1N1) and influenza A (H3N2) viruses.
- In the spring of 2009, a new influenza A (H1N1) virus (CDC 2009 H1N1 Flu website) emerged to cause illness in people.
- This virus was very different from the human influenza A (H1N1) viruses circulating at that time.
- The new virus caused the first influenza pandemic in more than 40 years.
- That virus (often called “2009 H1N1”) has now replaced the H1N1 virus that was previously circulating in humans.
Influenza B
- Influenza B viruses are not divided into subtypes, but can be further broken down into lineages and strains.
- Currently circulating influenza B viruses belong to one of two lineages: B/Yamagata and B/Victoria.
Structure
 |
- Influenza viruses (A, B and C) are very similar in overall structure, they arre single-stranded, enveloped, negative-sense RNA viruses.
- Influenza virus replicate inside the nucleus of the host-cell.
- The virus particle is 80–120 nanometers in diameter and usually roughly spherical, although filamentous forms can occur.[3][4]
- These filamentous forms are more common in influenza C, which can form cordlike structures up to 500 micrometers long on the surfaces of infected cells.
- The viral envelope contains two main types of glycoproteins, wrapped around a central core.
- The central core contains the viral RNA genome and other viral proteins that package and protect this RNA.
- RNA tends to be single stranded but in special cases it is double.[4] Unusually for a virus, its genome is not a single piece of nucleic acid; instead, it contains seven or eight pieces of segmented negative-sense RNA, each piece of RNA containing either one or two genes, which code for a gene product (protein).
- The influenza A genome contains 11 genes on eight pieces of RNA, encoding for 11 proteins: hemagglutinin (HA), neuraminidase (NA), nucleoprotein (NP), M1, M2, NS1, NS2(NEP: nuclear export protein), PA, PB1 (polymerase basic 1), PB1-F2 and PB2.[5]
- Hemagglutinin (HA) and neuraminidase (NA) are the two large glycoproteins on the outside of the viral particles.
- HA is a lectin that mediates binding of the virus to target cells and entry of the viral genome into the target cell, while NA is involved in the release of progeny virus from infected cells, by cleaving sugars that bind the mature viral particles.[6]
- These proteins are targets for antiviral drugs[7] and antigens to which antibodies can be raised.
Tropism
- The viruses attach to cells within the nasal passages and throat in the respiratory tract.
- The influenza virus’s hemagglutinin (HA) surface proteins then bind to the sialic acid receptors on the surface of a human respiratory tract cell.
- The structure of the influenza virus’s HA surface proteins is designed to fit the sialic acid receptors of the human cell, like a key to a lock.
- Once the key enters the lock, the influenza virus is then able to enter and infect the cell. This marks the beginning of a flu infection
Natural Reservoir
| Species | Hemagglutinin Subtypes |
Neuraminidase Subtypes |
|---|---|---|
| Humans | H1, H2, H3, H5, H6, H7, H9, H10 | N1, N2, N6, N7, N8, N9 |
| Poultry | H1, H2, H3, H4, H5, H6, H7, H8, H9, H10, H11, H12, H13, H14, H15, H16 | N1, N2, N3, N4, N5, N6, N7, N8, N9 |
| Pigs | H1, H2, H3, H4, H5, H9 | N1, N2 |
| Bats | H17, H18 | N10, N11 |
| Adapted from CDC [8] | ||
- In nature, the flu virus is found in wild aquatic birds, such as ducks and shore birds.
- It has persisted in these birds for millions of years and does not typically harm them; but the frequently mutating flu viruses can readily jump the species barrier from wild birds to domesticated poultry and swine.
- Pigs can be infected by both bird (avian) flu and the form that infects humans.
- In a setting such as a farm where chickens, pigs, and humans live in close proximity, pigs act as an influenza virus mixing bowl.
- If a pig is infected with avian and human flu simultaneously, the two types of virus may exchange genes.
- Such a “reassorted” flu virus can sometimes spread from pigs to people.
- Depending on the combination of avian flu proteins that make it into the human population, the flu may be more or less severe.
- In 1997, for the first time, scientists found that a form of avian H5N1 flu skipped the pig step and infected humans directly.
- Alarmed health officials feared a worldwide epidemic (a pandemic), but fortunately, the virus could not pass from person to person and thus did not spark an epidemic.
Microscopic Pathology
-
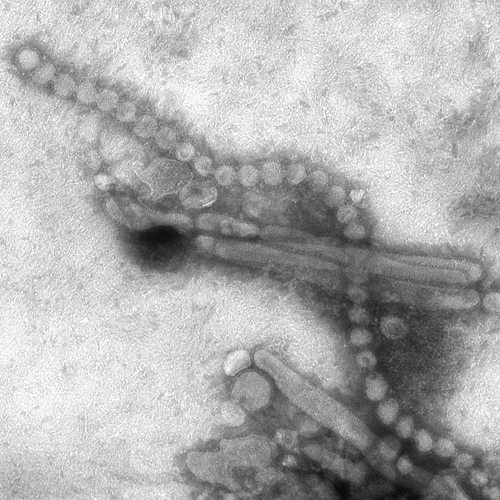 Electron Micrograph Images of H7N9 Virus from China.
Image obtained from CDC. -
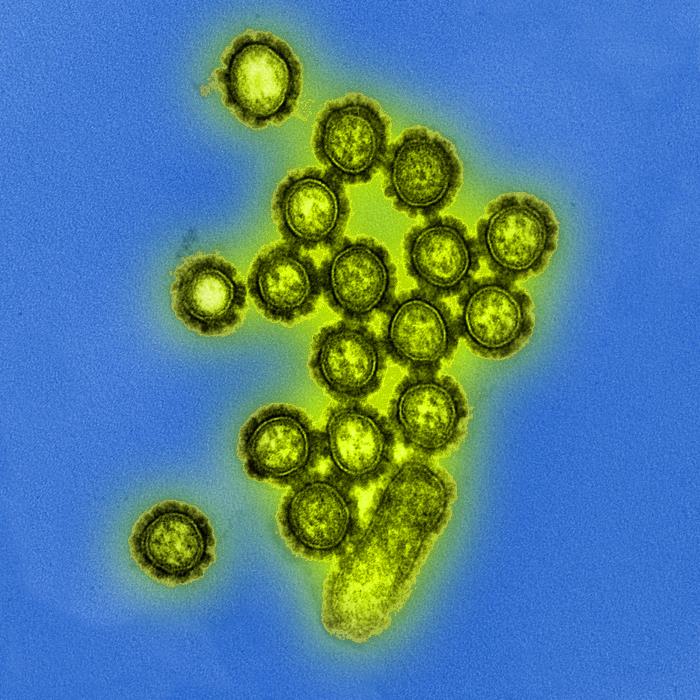 Produced by the National Institute of Allergy and Infectious Diseases (NIAID), this digitally-colorized transmission electron micrograph (TEM) depicts numbers of H1N1 influenza virus particles. Surface proteins located on the surface of the virus particles are shown in black.
Image obtained from Public Health Image Library (PHIL). -
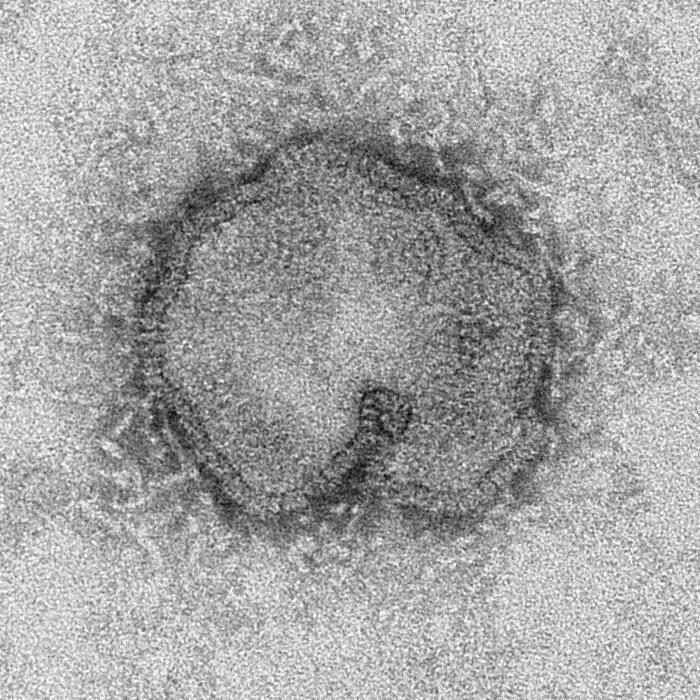 This negatively-stained transmission electron micrograph (TEM) captured some of the ultrastructural details exhibited by the new influenza A (H7N9) virus.
Image obtained from Public Health Image Library (PHIL). -
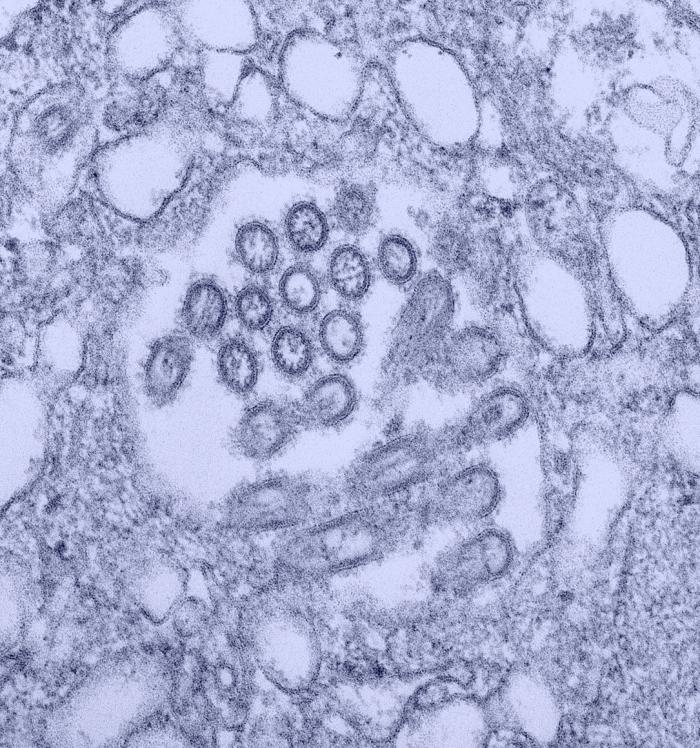 This colorized transmission electron micrograph (TEM) revealed the presence of a number of Novel H1N1 virus virions in this tissue culture sample.
Image obtained from Public Health Image Library (PHIL). -
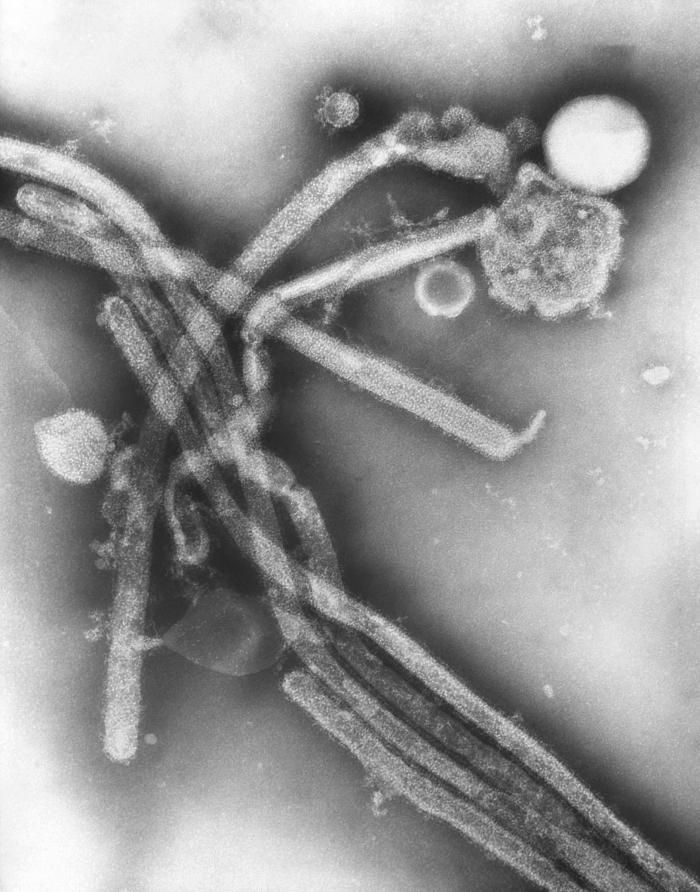 This negatively-stained transmission electron micrograph (TEM) revealed the presence of a number of Hong Kong flu virus virions, the H3N2 subtype of the influenza A virus.
Image obtained from Public Health Image Library (PHIL).


References
- ↑ 1.0 1.1 1.2 >“Taxonomy browser (Influenzavirus)”.
- ↑ “CDC Types of Influenza Viruses”.
- ↑ International Committee on Taxonomy of Viruses. “The Universal Virus Database, version 4: Influenza A”.
- ↑ 4.0 4.1 Lamb RA, Choppin PW (1983). “The gene structure and replication of influenza virus”. Annu. Rev. Biochem. 52: 467–506. doi:10.1146/annurev.bi.52.070183.002343. PMID 6351727.
- ↑ Ghedin, E; Sengamalay, NA; Shumway, M; Zaborsky, J; Feldblyum, T; Subbu, V; Spiro, DJ; Sitz, J; Koo, H (October 2005). “Large-scale sequencing of human influenza reveals the dynamic nature of viral genome evolution”. Nature. 437 (7062): 1162–6. Bibcode:2005Natur.437.1162G. doi:10.1038/nature04239. PMID 16208317.
- ↑ Suzuki, Y (2005). “Sialobiology of influenza: molecular mechanism of host range variation of influenza viruses”. Biol Pharm Bull. 28 (3): 399–408. doi:10.1248/bpb.28.399. PMID 15744059.
- ↑ Wilson, J; von Itzstein M (July 2003). “Recent strategies in the search for new anti-influenza therapies”. Curr Drug Targets. 4 (5): 389–408. doi:10.2174/1389450033491019. PMID 12816348.
- ↑ “CDC Seasonal Influenza – Transmission of Influenza Viruses from Animals to People”.
Editor-In-Chief: For more information about non-human (variant) influenza viruses that may be transmitted to humans, see Zoonotic influenza
C. Michael Gibson, M.S., M.D. [2]; Associate Editor(s)-in-Chief: Alejandro Lemor, M.D. [3]
Differentiating Influenza from other Diseases
Overview
Influenza is an acute respiratory illness caused by influenza viruses (types A, B, C, and D) that circulates seasonally worldwide. In most patients, influenza is self-limited, but it can cause severe illness and death, particularly in high-risk populations. The annual global burden of seasonal influenza includes an estimated 3-5 million cases of severe illness and 290,000-650,000 respiratory deaths. The clinical presentation overlaps with numerous other respiratory pathogens, making laboratory confirmation important for diagnosis and management.
Differentiating Influenza from Other Diseases
Clinical Features Distinguishing Influenza from Other Respiratory Viral Infections
Fever is the most discriminating clinical feature of influenza compared to other common respiratory viruses. In a 2026 cohort study of hospitalized adults, fever on admission was significantly more common in influenza patients compared to those with respiratory syncytial virus (RSV), and influenza patients more frequently reported myalgia, headache, sore throat, and gastrointestinal symptoms.[1] Conversely, RSV patients more often presented with sputum production, dyspnea, wheezing, and radiographic evidence of infection.[1]
Rhinovirus infections present with more upper respiratory symptoms than influenza. A 2025 study found that nasal discharge, sore throat, nasal congestion, sneezing, hoarseness, headache, and myalgia were significantly more common in rhinovirus infection, while fever was significantly higher in influenza (both types A and B).[2] Cough was common in both but more frequent in influenza A than influenza B.[2]
Human metapneumovirus (HMPV) and RSV share clinical overlap with influenza but differ in key features. In a French primary care study of 5,859 patients with influenza-like illness, cough was associated with influenza (OR 2.14), RSV (OR 2.52), and HMPV (OR 2.15), while rhinorrhea was primarily associated with human rhinovirus detection (OR 1.75).[3] Headache was associated with influenza detection (OR 1.75), whereas absence of headache was associated with RSV and HMPV. Dyspnea was associated with RSV (OR 2.33) and absence of dyspnea with influenza.[3]
No individual clinical feature is pathognomonic for any respiratory virus. A 2018 systematic review and prospective cohort study of 6,073 children with influenza-like illness confirmed that while certain features show statistical associations with specific viruses—fever and headache with influenza, cough and wheezing with RSV, rhinitis with rhinovirus—substantial overlap exists across all pathogens. The authors concluded that laboratory confirmation remains essential, as clinical features alone cannot reliably rule in or rule out any particular viral infection.[4]
Influenza-Like Illness (ILI) Case Definitions
The most validated ILI case definition for influenza detection is fever plus cough. A 2015 study of 1,581 emergency department patients found that the best predictive model for laboratory-confirmed influenza included cough (DOR 5.87), fever (DOR 4.49), rhinorrhea (DOR 1.98), and myalgias (DOR 1.44).[5] Case definitions combining these symptoms achieved sensitivity of 89-92% and specificity of 38-44%.[5] For children under 5 years, adding rhinorrhea to fever and cough improved the balance between sensitivity (85%) and specificity (47%).[5]
Distinguishing Influenza from COVID-19
COVID-19 and influenza have overlapping but distinguishable clinical presentations. A 2021 global meta-analysis of 75,164 COVID-19 cases, 113,818 influenza A cases, and 9,266 influenza B cases found that runny nose, dyspnea, sore throat, and rhinorrhea were less frequent in COVID-19 (14%, 15%, 11.5%, and 9.5%, respectively) compared to influenza A (70%, 45.5%, 49%, and 44.5%) and influenza B (74%, 33%, 38%, and 49%).[6]
Radiographic findings differ significantly. Most COVID-19 patients (84%) had abnormal chest imaging compared to influenza A (57%) and influenza B (33%).[6] COVID-19 demonstrated longer incubation period (6.4 days vs. 3.4 days for influenza A) and longer hospitalization duration (14 days vs. 6.5 days for influenza A and 6.7 days for influenza B).[6]
Specific CT features favor COVID-19 over influenza pneumonia. A 2022 study found that crazy-paving pattern, pure ground-glass opacities (GGO) in peripheral areas, pure GGO, lesion sizes 1-3 cm, emphysema, and pleural traction were significantly associated with COVID-19.[7] A combined model using CT features and clinical variables (temperature and white blood cell count) achieved an AUC of 0.991 in differentiating COVID-19 from influenza pneumonia.[7]
Distinguishing Influenza from Bacterial Pneumonia
Clinical features alone cannot reliably differentiate viral from bacterial pneumonia. However, certain patterns may suggest bacterial etiology:
- Atypical bacterial pneumonias (Mycoplasma pneumoniae, Chlamydia pneumoniae, Legionella pneumophila) present with gradual onset, prominent cough, and less severe systemic symptoms compared to influenza’s abrupt onset with high fever and myalgias. Legionella infection is associated with hyponatremia, abnormal liver function tests, confusion, and diarrhea—features less common in uncomplicated influenza.
- Typical bacterial pneumonia (Streptococcus pneumoniae, Staphylococcus aureus) may follow influenza as a secondary infection, presenting with worsening symptoms after initial improvement, productive cough with purulent sputum, focal consolidation on imaging, and elevated white blood cell count with neutrophilia.
Diagnostic Testing Recommendations
Molecular assays are preferred over rapid antigen tests, especially in hospitalized patients. The Infectious Diseases Society of America (IDSA) and American Society for Microbiology (ASM) 2024 update on diagnostic microbiology provides comprehensive guidance on laboratory testing for influenza.[8] For adult patients, molecular assays (e.g., RT-PCR) are the preferred diagnostic modality for hospitalized patients and those with risk factors for severe disease.
The American Academy of Pediatrics (AAP) 2023-2024 and 2025-2026 guidelines recommend that hospitalized patients with signs and symptoms of influenza should be tested with a molecular assay with high sensitivity and specificity when influenza is circulating in the community.[9][10] Rapid molecular assays are highly sensitive and preferred over rapid influenza diagnostic tests (RIDTs) in ambulatory children.[9][10]
RIDTs have suboptimal sensitivity (50-70%) in ambulatory settings.[10] The 2025-2026 AAP guidelines state: “The typical sensitivity of a rapid test performed in a physician’s office is 50% to 70%.”[10] During periods of high community influenza activity, clinicians should consider confirming negative RIDTs with a molecular test due to suboptimal sensitivity and potential for false-negative results.[11][9]
Positive and negative predictive values are influenced by the level of influenza activity in the population being tested. During periods of low community influenza prevalence, positive results are more likely to be false positives; during high prevalence, negative results are more likely to be false negatives.[10][11] Clinicians interpreting test results should consider the local epidemiology.
Multiplex assays are valuable when multiple respiratory viruses cocirculate. Multiplex assays that simultaneously detect influenza viruses, SARS-CoV-2, and RSV are particularly useful when these viruses cocirculate, as clinical differentiation is difficult and different treatment strategies are recommended.[11][9][10]
H5 Avian Influenza Testing Considerations
Given the ongoing H5N1 outbreak in 2025-2026, the AAP guidelines recommend expedited subtyping of influenza A specimens from hospitalized patients to evaluate for H5 infection.[10] Clinicians should be aware of local and national surveillance systems for novel influenza A viruses and coordinate with public health authorities when H5 infection is suspected.
Over-the-Counter Home Testing
The FDA has granted emergency use authorization for at-home multiplex tests detecting influenza A/B and SARS-CoV-2 in children as young as 2 years.[10] These tests may facilitate early detection but should be interpreted with caution given the sensitivity limitations of rapid antigen tests.
Differential Diagnosis Table
| Pathogen/Condition | Key Distinguishing Features | Laboratory/Imaging Findings | References |
|---|---|---|---|
| Influenza | Abrupt onset, high fever (100-102°F), prominent myalgias, headache, dry cough; less rhinorrhea than common cold | Normal or mildly elevated WBC; bilateral infiltrates on chest imaging if pneumonia develops | [1][2][3] |
| Rhinovirus | Prominent nasal discharge, sore throat, nasal congestion, sneezing; fever less common | Normal WBC; minimal chest imaging findings | [2][4] |
| RSV | Dyspnea, wheezing, sputum production more prominent; older and more comorbid patients; less fever, myalgia, headache than influenza | Elevated WBC; radiographic evidence of infection more common; wheezing on exam | [1][3] |
| COVID-19 | Less rhinorrhea, sore throat, dyspnea than influenza; longer incubation (6.4 vs 3.4 days); anosmia/ageusia | Higher lymphocyte count than influenza; abnormal chest imaging in 84%; peripheral GGO, crazy-paving pattern on CT | [6][7] |
| HMPV | Cough prominent; absence of headache; clinical overlap with RSV | Similar to RSV | [3] |
| Adenovirus | Fever, conjunctivitis, pharyngitis; may cause prolonged illness | Normal or elevated WBC | [4] |
| Bacterial pneumonia (S. pneumoniae, S. aureus) | Productive cough with purulent sputum, focal chest findings, may follow influenza as secondary infection | Leukocytosis with neutrophilia; focal consolidation on imaging | Clinical knowledge |
| Atypical pneumonia (Mycoplasma, Chlamydia, Legionella) | Gradual onset, prominent cough, less severe systemic symptoms; Legionella: confusion, diarrhea, hyponatremia | Legionella: hyponatremia, abnormal LFTs; Mycoplasma: normal or mildly elevated WBC | Clinical knowledge |
| Common cold | Prominent nasal congestion, sneezing, sore throat; fever rare; milder systemic symptoms | Normal WBC; no chest imaging abnormalities | Clinical knowledge |
Non-Infectious Conditions in the Differential
Several non-infectious conditions may mimic influenza:
- Drug-induced flu-like illness: Interferons, monoclonal antibodies, bisphosphonates, and chemotherapeutic agents can cause fever, myalgias, and fatigue
- Vaccination reactions: Typically transient and mild, occurring within 24-48 hours of immunization
- Pulmonary embolism: May present with dyspnea, chest pain, and tachycardia; consider in patients with risk factors
- Acute exacerbations of chronic lung disease (asthma, COPD): Dyspnea and cough prominent; history of underlying lung disease
- Myocarditis/pericarditis: Chest pain, dyspnea; may follow viral prodrome; elevated cardiac biomarkers
- Hematologic malignancies: Fever, fatigue, night sweats; cytopenias on CBC
High-Yield Clinical Pearls
- Fever is the most discriminating feature for influenza versus other common respiratory viruses; prominent upper respiratory symptoms (rhinorrhea, nasal congestion, sneezing) favor rhinovirus or common cold.[2][3]
- Fever plus cough is the most validated ILI case definition, achieving 89-92% sensitivity for influenza detection.[5]
- RIDT sensitivity is only 50-70%: Negative rapid antigen tests do not rule out influenza during periods of high community activity; consider molecular confirmation.[10][9]
- RSV patients are typically older, more comorbid, and present with more dyspnea and wheezing than influenza patients, despite similar mortality risk.[1]
- COVID-19 typically presents with less rhinorrhea and sore throat than influenza, longer incubation period, and more frequent abnormal chest imaging.[6]
- Multiplex testing is preferred when influenza, COVID-19, and RSV cocirculate because clinical differentiation is unreliable and treatment strategies differ.[11][9][10]
- Hyponatremia, abnormal liver function tests, confusion, and diarrhea suggest Legionella rather than influenza.
- PPV/NPV vary with prevalence: During low influenza activity, positive test results may be false positives; during high activity, negative results may be false negatives.[10]
Common Pitfalls
- Relying on clinical diagnosis alone when laboratory testing is available; no symptom combination reliably excludes influenza.[4]
- Accepting negative RIDTs without confirmation during high influenza activity periods; RIDTs have suboptimal sensitivity (50-70%).[10][11][9]
- Failing to consider COVID-19 in the differential diagnosis of ILI; overlapping presentations require multiplex testing for accurate diagnosis.[7][6]
- Assuming absence of fever rules out influenza; while fever is common, some influenza patients present without documented fever, particularly elderly or immunocompromised individuals.
- Not considering secondary bacterial pneumonia in influenza patients who initially improve then worsen; this represents a distinct clinical entity requiring antibacterial therapy.
- Testing during low influenza prevalence without considering the increased risk of false-positive results.[9][10]
- Overlooking non-infectious causes of flu-like illness, particularly drug-induced reactions in patients on interferons, monoclonal antibodies, or chemotherapy.
- Failing to consider H5 avian influenza in hospitalized patients with influenza A during the 2025-2026 outbreak; expedited subtyping is recommended.[10]
References
- ↑ 1.0 1.1 1.2 1.3 1.4 Hovind MJ, Berdal JE, Dalgard O, Lyngbakken MN (2026). “A Comparison of Clinical Characteristics and Mortality in Hospitalised Patients With Respiratory Syncytial Virus and Influenza Virus Infections: A Cohort Study”. Infectious Diseases (London, England). 58 (6): 605–615. doi:10.1080/23744235.2026.2621994.
- ↑ 2.0 2.1 2.2 2.3 2.4 Iyadorai T, Wong PL, Sii HL; et al. (2025). “Respiratory Symptoms and Health Outcomes of Rhinovirus and Influenza Virus Infections: Implications of Asthma, Diabetes Mellitus and Allergic Rhinitis in Rhinovirus C Infection”. Journal of Medical Virology. 97 (3): e70281. doi:10.1002/jmv.70281.
- ↑ 3.0 3.1 3.2 3.3 3.4 3.5 Souty C, Masse S, Valette M; et al. (2019). “Baseline Characteristics and Clinical Symptoms Related to Respiratory Viruses Identified Among Patients Presenting With Influenza-Like Illness in Primary Care”. Clinical Microbiology and Infection. 25 (9): 1147–1153. doi:10.1016/j.cmi.2019.01.014.
- ↑ 4.0 4.1 4.2 4.3 Ma X, Conrad T, Alchikh M; et al. (2018). “Can we distinguish respiratory viral infections based on clinical features? A prospective pediatric cohort compared to systematic literature review”. Reviews in Medical Virology. 28 (5): e1997. doi:10.1002/rmv.1997.
- ↑ 5.0 5.1 5.2 5.3 Shah SC, Rumoro DP, Hallock MM; et al. (2015). “Clinical Predictors for Laboratory-Confirmed Influenza Infections: Exploring Case Definitions for Influenza-Like Illness”. Infection Control and Hospital Epidemiology. 36 (3): 241–248. doi:10.1017/ice.2014.64.
- ↑ 6.0 6.1 6.2 6.3 6.4 6.5 Pormohammad A, Ghorbani S, Khatami A; et al. (2021). “Comparison of influenza type A and B with COVID-19: A global systematic review and meta-analysis on clinical, laboratory and radiographic findings”. Reviews in Medical Virology. 31 (3): e2179. doi:10.1002/rmv.2179.
- ↑ 7.0 7.1 7.2 7.3 Yang Z, Lin D, Chen X; et al. (2022). “Distinguishing COVID-19 From Influenza Pneumonia in the Early Stage Through CT Imaging and Clinical Features”. Frontiers in Microbiology. 13: 847836. doi:10.3389/fmicb.2022.847836.
- ↑ Miller JM, Binnicker MJ, Campbell S; et al. (2024). “Guide to Utilization of the Microbiology Laboratory for Diagnosis of Infectious Diseases: 2024 Update by the Infectious Diseases Society of America and the American Society for Microbiology”. Clinical Infectious Diseases. doi:10.1093/cid/ciae104.
- ↑ 9.0 9.1 9.2 9.3 9.4 9.5 9.6 9.7 Committee on Infectious Diseases (2023). “Recommendations for Prevention and Control of Influenza in Children, 2023-2024”. Pediatrics. 152 (4): e2023063773. doi:10.1542/peds.2023-063773.
- ↑ 10.00 10.01 10.02 10.03 10.04 10.05 10.06 10.07 10.08 10.09 10.10 10.11 10.12 10.13 Committee on Infectious Diseases (2025). “Recommendations for Prevention and Control of Influenza in Children, 2025-2026: Technical Report”. Pediatrics. doi:10.1542/peds.2025-073622.
- ↑ 11.0 11.1 11.2 11.3 11.4 “Recommendations for Prevention and Control of Influenza in Children, 2022-2023”. Pediatrics. 150 (4): e2022059275. 2022. doi:10.1542/peds.2022-059275.
Editor-In-Chief: C. Michael Gibson, M.S., M.D. [1] Associate Editor(s)-in-Chief: Mohammad Braizat, M.S. [2]
Epidemiology and Demographics
Epidemiology and Demographics
Overview
Seasonal influenza epidemics cause substantial morbidity and mortality worldwide. The World Health Organization (WHO) estimates annual epidemics result in **3–5 million cases of severe illness** and **290,000–650,000 respiratory deaths** globally.[1][2] In the United States, the CDC estimates that during the 2010–2020 decade, annual influenza-related burden ranged from 9–45 million symptomatic illnesses, 140,000–810,000 hospitalizations, and 12,000–61,000 deaths.[3][4] The 2024–2025 season was the first high-severity season since 2017–2018, with the highest measured influenza-associated hospitalization rates since the 2010–2011 season.[5]
Global Disease Burden
The WHO estimates that annual epidemics result in 3–5 million cases of severe illness and 290,000–650,000 respiratory deaths globally.[1][2] A 2021 Global Burden of Disease analysis found that the global age-standardized mortality rate from influenza-associated lower respiratory infections declined from 5.87 per 100,000 in 1990 to 1.30 per 100,000 in 2021, though absolute deaths increased by 0.85% annually from 1990 to 2019 due to population growth and aging.[6]
Among children younger than 5 years, an estimated 110 million influenza illnesses, 870,000 hospitalizations, and approximately 35,000 deaths from influenza-associated acute lower respiratory tract disease occurred worldwide in 2018, with most in-hospital deaths in low- and middle-income countries.[1] Among adults, more than 32 million cases and 5.7 million hospitalizations from influenza-associated lower respiratory tract disease occur annually, with the highest hospitalization rates in adults aged ≥65 years.[1]
United States Disease Burden
The CDC estimates that during the 2010–2020 decade, annual influenza-related burden in the United States ranged from:[3][4]
- 9–45 million symptomatic illnesses
- 4–21 million medical visits
- 140,000–810,000 hospitalizations
- 12,000–61,000 deaths
2024–2025 Season (High Severity)
The 2024–2025 season was the first high-severity season since 2017–2018 and had the highest measured influenza-associated hospitalization rates since the 2010–2011 season.[5][7][8] Preliminary estimates (later revised as surveillance data matured) include:[9]
- 43–73 million estimated illnesses
- 19–32 million medical visits
- 560,000–1.1 million hospitalizations
- 38,000–99,000 estimated deaths
- Cumulative hospitalization rate: 127.1 per 100,000 (surpassing all end-of-season rates since 2010–2011)[5]
- Rates were highest among persons aged ≥75 years (598.8 per 100,000)[5]
- Influenza A(H1N1)pdm09 and A(H3N2) co-circulated in roughly equal proportions[10][8]
- Pediatric deaths: 279–289 reported depending on reporting cutoff date[11][9][12] (final counts vary by surveillance endpoint); 89% of vaccine-eligible children who died were not fully vaccinated[11]
Age Distribution
Influenza viruses cause disease across all age groups, but the burden is distributed unevenly:[1][3]
- Children: Infection rates are highest in children, particularly those aged 0–4 years. Hospitalization and in-hospital mortality rates are highest in infants younger than 6 months, a group that is too young for vaccination and depends on maternal immunization and cocooning strategies.[8] During the 2024–2025 season, hospitalization rates in children <1 year were 149.4/100,000 and rates in children 0–4 years were 100.8/100,000, exceeding 2023–2024 rates.[8][5]
- Adults aged 50–64 years: Intermediate hospitalization rates; this group is recognized as higher risk by the CDC.
- Adults aged ≥65 years: The highest mortality rates from influenza occur in this group. Epidemics caused by influenza A(H3N2) viruses are associated with particularly high morbidity and mortality in older adults. Elderly patients with comorbidities such as congestive heart failure, COPD, coronary artery disease, or late-stage chronic kidney disease have 3–7 times higher 30-day hospitalization rates compared with matched patients without influenza.[1][13]
Sex and Pregnancy
There is no significant sex-based difference in influenza infection rates. However, pregnant persons are at increased risk for severe illness, particularly in the third trimester through 2 weeks postpartum.[1][3] Among women of reproductive age hospitalized with influenza over nine U.S. seasons, nearly 28% were pregnant, and 62% were in their third trimester.[1] A meta-analysis found that pregnant persons were at higher risk of hospitalization but not ICU admission or death compared with non-pregnant persons.[1]
Racial and Ethnic Disparities
Significant racial and ethnic disparities exist in both influenza disease severity and vaccination coverage in the United States.[14][8] These disparities persist even after adjusting for insurance status, presence of a personal healthcare provider, and recent healthcare utilization, suggesting additional factors contribute to inequitable outcomes.[14]
Disease burden: From 2009–2010 through 2021–2022, age-adjusted influenza hospitalization rates were higher among Black (RR 1.8), American Indian/Alaska Native (RR 1.3), and Hispanic (RR 1.2) adults compared with White adults.[14] Among children ≤4 years, hospitalization rates were 2–3 times higher in Black, Hispanic, and American Indian/Alaska Native children compared with White children, and in-hospital death rates were 3–4 times higher in Black, Hispanic, and Asian/Pacific Islander children.[8]
Vaccination coverage: During the 2021–2022 season, influenza vaccination coverage was lower among Hispanic (37.9%), American Indian/Alaska Native (40.9%), and Black (42.0%) adults compared with White (53.9%) and Asian (54.2%) adults.[14] Among children, the coverage gap between non-Hispanic Asian and non-Hispanic Black children ranged from 15 to 33 percentage points depending on age group.[15]
Populations at Increased Risk for Complications
The CDC and ACIP identify the following groups as at increased risk for influenza complications:[3][16][17]
- Children <5 years (especially <2 years)
- Adults ≥65 years
- Pregnant persons and those up to 2 weeks postpartum
- Residents of long-term care facilities
- Individuals with chronic medical conditions:
 * Pulmonary (asthma, COPD, cystic fibrosis)
 * Cardiovascular (excluding hypertension alone)
 * Renal
 * Hepatic
 * Neurologic/neurodevelopmental
 * Metabolic (diabetes mellitus)
 * Hematologic (sickle cell disease)
 * Immunosuppression (HIV, cancer, transplant, chronic steroids)
- Individuals with obesity (BMI ≥40 kg/m²)
- Children and adolescents receiving aspirin or salicylate-containing medications (risk of Reye syndrome)[16]
- American Indian/Alaska Native persons[14]
Seasonality and Geographic Patterns
Influenza seasonality varies by latitude and climate:[1][3][18]
- Temperate regions: Epidemics occur during cooler months — October through March in the Northern Hemisphere and April through September in the Southern Hemisphere. Epidemic peaks typically occur from December to March (Northern) and May to August (Southern). Median epidemic duration is approximately 10 weeks above 30°N latitude.[18]
- Tropical and subtropical regions: Influenza can circulate year-round, with one or more peaks during periods of higher absolute humidity or precipitation. Epidemic timing is highly heterogeneous, and duration ranges from 15 to 30 weeks.[1][18]
- Post-pandemic patterns: Global influenza positivity rates rose from 3.0% in 2021 to 23.7% in 2024, indicating convergence toward pre-pandemic seasonal patterns, though changes in lineage ecology and epidemic duration persist.[18]
Circulating Virus Subtypes and Lineage Changes
Three types of influenza virus cause seasonal epidemics: influenza A(H1N1)pdm09, influenza A(H3N2), and influenza B (Victoria lineage). Key virological trends include:
- Influenza A(H3N2) seasons are associated with higher morbidity and mortality, particularly in older adults. A(H3N2) dominated in 2021–2022 and 2022–2023.[1]
- Influenza A(H1N1)pdm09 predominated in 2023–2024 and co-circulated with A(H3N2) in 2024–2025.[8][10]
- Influenza B/Yamagata lineage has not been conclusively detected since March 2020 and is considered probably extinct. This was driven by reduced transmission from COVID-19 nonpharmaceutical interventions combined with a depleted susceptible population due to conserved antigenicity and the large 2017–2018 B/Yamagata outbreak.[19][20] The WHO recommended exclusion of B/Yamagata from influenza vaccines beginning with the 2024 Southern Hemisphere season, prompting a global transition from quadrivalent to trivalent vaccine formulations.[21]
- Influenza B/Victoria is now the sole circulating influenza B lineage.[18]
Impact of the COVID-19 Pandemic on Influenza Epidemiology
The COVID-19 pandemic profoundly disrupted global influenza circulation:[3][22][23]
- Nonpharmaceutical interventions (masking, social distancing, travel restrictions) caused a sharp decline in influenza activity during 2020–2021, with near-absence of seasonal influenza globally.[3][22]
- Influenza A activity gradually recovered beginning in 2021–2022, while influenza B recovery has been slower and with reduced lineage diversity.[24]
- Post-pandemic rebound has been notable: the 2022–2023 season featured early onset and high severity in children, and the 2024–2025 season was the most severe in over a decade.[25][5][8]
- Working-age adults (15–64 years) showed the most pronounced post-pandemic surge in relative risk of influenza in some analyses, potentially reflecting immune waning during the period of low circulation.[23]
- The B/Yamagata lineage was lost during this period (see above).[19][20]
Vaccination Coverage
Annual influenza vaccination is recommended by the CDC/ACIP for all persons aged ≥6 months without contraindications, with particular emphasis on healthcare personnel and household contacts of high-risk persons to reduce transmission to vulnerable populations.[16]
- United States: Overall vaccination coverage peaked at approximately 46% in 2019–2020 and declined to approximately 40% in 2022–2023. Coverage is approximately 50–60% among children and adults combined. Declines have been most substantial among children, with coverage for children aged 6 months through 8 years falling by 14 percentage points from peak to the 2022–2023 season.[26][1]
- Global: As of 2022, 128 of 194 WHO member states had a seasonal influenza vaccination policy. Median coverage rates were 37% for pregnant women, 55% for older adults, and 62% for health workers.[27]
- Adults aged ≥65 years: Preferentially recommended to receive higher-dose or adjuvanted vaccines (HD-IIV, RIV4, or aIIV4).[16]
Zoonotic and Pandemic Influenza
Influenza A viruses circulate among animal populations and occasionally infect humans. The primary reservoirs are wild waterfowl, but influenza A viruses also circulate in domestic poultry, swine, and — since 2024 — dairy cattle.[3][28]
Highly pathogenic avian influenza A(H5N1):
- Since 1997, over 1,100 human cases of H5N1 have been reported globally. The currently dominant clade 2.3.4.4b has driven a global panzootic in birds and mammals, with spillover into dairy cattle in the United States since early 2024.[29][28]
- As of mid-2025, 70 human H5N1 cases had been reported in the United States, mostly in adults with occupational exposure to dairy cattle or poultry.[8]
- Adjusted case-fatality risk for clade 2.3.4.4b is estimated at 0.7% (95% CI: 0.02–3.9%), substantially lower than earlier clades (range 4.7–15.0%).[29]
- Sustained human-to-human transmission has not been observed, but zoonotic transmission has increased with bovine-origin clade 2.3.4.4b.[29][28]
- Clinicians should maintain awareness of H5N1 in patients with occupational exposure to poultry or dairy cattle presenting with severe respiratory illness.
Antiviral Treatment Gaps
Epidemiologic surveillance data from the 2024–2025 season revealed that only 40% of children who died from influenza received antiviral treatment, with antiviral receipt lowest among children aged 5–17 years (61.6%).[11][8] This represents a clinically actionable gap in care, particularly given that early antiviral treatment (within 48 hours of symptom onset) is associated with improved outcomes in high-risk patients.
High-Yield Clinical Pearls
- Annual U.S. influenza burden varies widely (9–45 million illnesses, 12,000–61,000 deaths), driven largely by the predominant circulating subtype and antigenic match with the vaccine.[3][4]
- A(H3N2)-predominant seasons tend to cause higher morbidity and mortality, especially in older adults.
- Infants <6 months have the highest hospitalization rates among children but are too young for vaccination; they depend on maternal immunization during pregnancy and cocooning by vaccinated household contacts.[8]
- Adults ≥65 years, pregnant persons, and individuals with chronic medical conditions are at highest risk for complications.
- The 2024–2025 season was the most severe since 2017–2018, with pediatric deaths totaling 279–289 depending on the reporting cutoff.[11][9][12]
- Influenza B/Yamagata is considered probably extinct; WHO has recommended removal from vaccines, with global transition to trivalent formulations.[20][21]
- Significant racial/ethnic disparities persist in both influenza hospitalization rates and vaccination coverage, even after adjusting for healthcare access.[14]
- COVID-19 pandemic-related nonpharmaceutical interventions disrupted influenza circulation and may have contributed to post-pandemic rebound and loss of B/Yamagata lineage.[22]
- Vaccination coverage in the U.S. has declined since the pandemic, particularly among children.[26]
- Among children who died from influenza during the 2024–2025 season, 44% had no underlying medical conditions, and only 11% of vaccine-eligible children who died were fully vaccinated.[11][8]
- Only 40% of children who died received antiviral treatment, highlighting a critical gap in clinical care.[11]
References
- ↑ 1.00 1.01 1.02 1.03 1.04 1.05 1.06 1.07 1.08 1.09 1.10 1.11 1.12 Uyeki TM, Hui DS, Zambon M, Wentworth DE, Monto AS (2022). “Influenza”. Lancet. 400 (10353): 693–706. doi:10.1016/S0140-6736(22)00982-5. PMID 36001333 Check
|pmid=value (help). - ↑ 2.0 2.1 Iuliano AD, Roguski KM, Chang HH; et al. (2018). “Estimates of global seasonal influenza-associated respiratory mortality: a modelling study”. Lancet. 391 (10127): 1285–1300. doi:10.1016/S0140-6736(17)33293-2. PMID 29548687.
- ↑ 3.00 3.01 3.02 3.03 3.04 3.05 3.06 3.07 3.08 3.09 Molly Valleau and Christine M. Szablewski. Influenza. CDC Yellow Book.
- ↑ 4.0 4.1 4.2 Tokars JI, Olsen SJ, Reed C (2018). “Seasonal Incidence of Symptomatic Influenza in the United States”. Clin Infect Dis. 68 (10): 1517–1524. doi:10.1093/cid/ciy793.
- ↑ 5.0 5.1 5.2 5.3 5.4 5.5 O’Halloran A, Habeck JW, Gilmer M; et al. (2025). “Influenza-Associated Hospitalizations During a High Severity Season – Influenza Hospitalization Surveillance Network, United States, 2024-25 Influenza Season”. MMWR Morb Mortal Wkly Rep. 74 (34): 529–537. doi:10.15585/mmwr.mm7434a1.
- ↑ Shao C, Huang X, Zhang H; et al. (2026). “Global, regional, and national burden of influenza-associated lower respiratory infections, 1990-2021: a systematic analysis from the Global Burden of Disease Study 2021”. BMC Infect Dis. 26 (1): 202. doi:10.1186/s12879-025-12282-7. PMID 39955400 Check
|pmid=value (help). - ↑ Sophie Zhu, PhD, Joshua Quint, PhD, Tomás M. León, PhD; et al. (2026). “Influenza Vaccine and Associated Infection and Death in California, 2024 to 2025”. JAMA Netw Open. doi:10.1001/jamanetworkopen.2026.17684.
- ↑ 8.00 8.01 8.02 8.03 8.04 8.05 8.06 8.07 8.08 8.09 8.10 8.11 Committee on Infectious Diseases (2025). “Recommendations for Prevention and Control of Influenza in Children, 2025-2026: Technical Report”. Pediatrics. doi:10.1542/peds.2025-073622.
- ↑ 9.0 9.1 9.2 Zambon M, Hayden FG (2025). “Influenza”. JAMA. 334 (24). doi:10.1001/jama.2025.24831.
- ↑ 10.0 10.1 Villafuerte D, Fall A, Akin E; et al. (2026). “Genomic Evolution of Influenza a Virus During the 2024-2025 Season, the Johns Hopkins Health System: Antigenic Drift Reduces Serum Neutralization”. J Infect Dis. 233 (6): e1386–e1395. doi:10.1093/infdis/jiag069.
- ↑ 11.0 11.1 11.2 11.3 11.4 11.5 Reinhart K, Huang S, Kniss K, Reed C, Budd A (2025). “Influenza-Associated Pediatric Deaths – United States, 2024-25 Influenza Season”. MMWR Morb Mortal Wkly Rep. 74 (36): 565–569. doi:10.15585/mmwr.mm7436a2.
- ↑ 12.0 12.1 Leonard JS; et al. (2026). “Pediatric Influenza-Associated Deaths, United States, 2024-2025”. Pediatrics. doi:10.1542/peds.2026-070000.
- ↑ Near AM, Tse J, Young-Xu Y, Hong DK, Reyes CM (2022). “Burden of influenza hospitalization among high-risk groups in the United States”. BMC Health Serv Res. 22 (1): 1209. doi:10.1186/s12913-022-08586-y. PMID 36151503 Check
|pmid=value (help). - ↑ 14.0 14.1 14.2 14.3 14.4 14.5 Black CL, O’Halloran A, Hung MC; et al. (2022). “Vital Signs: Influenza Hospitalizations and Vaccination Coverage by Race and Ethnicity-United States, 2009-10 Through 2021-22 Influenza Seasons”. MMWR Morb Mortal Wkly Rep. 71 (43): 1366–1373. doi:10.15585/mmwr.mm7143e1.
- ↑ Irving SA, Groom HC, Belongia EA; et al. (2025). “Differences in influenza vaccination coverage by race and ethnicity across age groups in the Vaccine Safety Datalink, 2017-18 through 2022-23 influenza seasons”. Vaccine. 64: 127667. doi:10.1016/j.vaccine.2025.127667.
- ↑ 16.0 16.1 16.2 16.3 Grohskopf LA, Blanton LH, Ferdinands JM; et al. (2022). “Prevention and Control of Seasonal Influenza With Vaccines: Recommendations of the Advisory Committee on Immunization Practices – United States, 2022-23 Influenza Season”. MMWR Recomm Rep. 71 (1): 1–28. doi:10.15585/mmwr.rr7101a1.
- ↑ Committee on Infectious Diseases (2019). “Recommendations for Prevention and Control of Influenza in Children, 2019-2020”. Pediatrics. 144 (4): e20192478. doi:10.1542/peds.2019-2478.
- ↑ 18.0 18.1 18.2 18.3 18.4 Del Riccio M, Caini S (2026). “Global influenza epidemiology after 2020: patterns of circulation, epidemic timing and duration, and implications for vaccination strategies”. Euro Surveill. 31 (21). doi:10.2807/1560-7917.ES.2026.31.21.2500743.
- ↑ 19.0 19.1 Han W, Zeng J, Shi J; et al. (2025). “Unraveling the mechanism behind the probable extinction of the B/Yamagata lineage of influenza B viruses”. Nat Commun. 16 (1): 10440. doi:10.1038/s41467-025-65396-6.
- ↑ 20.0 20.1 20.2 Caini S, Meijer A, Nunes MC; et al. (2024). “Probable extinction of influenza B/Yamagata and its public health implications: a systematic literature review and assessment of global surveillance databases”. Lancet Microbe. 5 (8): 100851. doi:10.1016/S2666-5247(24)00066-1.
- ↑ 21.0 21.1 Fisman D, Pérez-Rubio A, Postma M, Smith DS, Mould-Quevedo J (2025). “Maintaining the value of influenza vaccination – the shift from quadrivalent to trivalent vaccines: an expert review”. Expert Rev Vaccines. 24 (1): 499–508. doi:10.1080/14760584.2025.2515597.
- ↑ 22.0 22.1 22.2 Dhanasekaran V, Sullivan S, Edwards KM; et al. (2022). “Human seasonal influenza under COVID-19 and the potential consequences of influenza lineage elimination”. Nat Commun. 13 (1): 1721. doi:10.1038/s41467-022-29402-5.
- ↑ 23.0 23.1 Gao X, Qin P, Qi X; et al. (2026). “Suppression and resurgence: the evolving epidemiology of seasonal influenza from 2015 to 2024 in a core urban district of Beijing, China”. Front Public Health. 14: 1800701. doi:10.3389/fpubh.2026.1800701.
- ↑ Yang L, Riaz M, Rahman NU (2026). “Asymmetric post-pandemic recovery of influenza A and B since 2020 in Hong Kong: an interrupted time-series (ITS) analysis of weekly surveillance data with subtype and lineage characterization”. BMC Infect Dis. doi:10.1186/s12879-026-13714-8.
- ↑ White EB, O’Halloran A, Sundaresan D; et al. (2023). “High Influenza Incidence and Disease Severity Among Children and Adolescents Aged <18 Years – United States, 2022-23 Season”. MMWR Morb Mortal Wkly Rep. 72 (41): 1108–1114. doi:10.15585/mmwr.mm7241a2.
- ↑ 26.0 26.1 Irving SA, Groom HC, Belongia EA; et al. (2023). “Influenza vaccination coverage among persons ages six months and older in the Vaccine Safety Datalink in the 2017-18 through 2022-23 influenza seasons”. Vaccine. 41 (48): 7138–7146. doi:10.1016/j.vaccine.2023.10.023.
- ↑ Goldin S, Brooks D, Jorgensen P; et al. (2024). “Seasonal influenza vaccination: A global review of national policies in 194 WHO Member States in 2022”. Vaccine. 42 (26): 126274. doi:10.1016/j.vaccine.2024.126274.
- ↑ 28.0 28.1 28.2 Peacock TP, Moncla L, Dudas G; et al. (2025). “The global H5N1 influenza panzootic in mammals”. Nature. 637 (8045): 304–313. doi:10.1038/s41586-024-08054-z.
- ↑ 29.0 29.1 29.2 Wang W, Xing J, Jiang H; et al. (2026). “Human infections with avian influenza A(H5) viruses with potential pandemic risk: 1997-2025”. Natl Sci Rev. 13 (7): nwaf471. doi:10.1093/nsr/nwaf471.
Editor-In-Chief: C. Michael Gibson, M.S., M.D. [1] Associate Editor(s)-in-Chief: Mohammad Braizat, M.S. [2]
Risk Factors
Risk Factors
Overview
Risk factors for influenza can be categorized into those that increase the likelihood of acquiring infection and those that increase the risk of severe disease, complications, hospitalization, and death following infection. The CDC and ACIP have established a high-risk list that serves as the foundation for clinical decision-making regarding vaccination prioritization and empiric antiviral treatment.[1] Age is the single strongest predictor of influenza-related hospitalization and death.[2]
Host-Related Risk Factors for Severe Influenza
Age
The CDC/ACIP identifies all persons aged ≥50 years as a high-risk group, with risk increasing progressively with age.[1] For clinical discussion, adults 50–64 years have intermediate hospitalization rates, while adults ≥65 years consistently have the highest influenza-associated hospitalization and mortality rates across all age groups. Immunosenescence contributes to impaired vaccine responses and increased susceptibility to severe disease in older adults.[2][3]
The CDC/ACIP also identifies children <5 years (especially <2 years) as high-risk.[1][4]
- Infants <6 months have the highest hospitalization and mortality rates among children but are too young for vaccination, making them dependent on maternal immunization and cocooning strategies.[5]
- Children <5 years have the highest infection rates among all age groups. In the 2024–2025 season, hospitalization rates in children <1 year were 149.4/100,000 and in children 0–4 years were 100.8/100,000.[5]
Pregnancy and Postpartum Period
Pregnant persons are at increased risk for severe influenza, particularly in the third trimester through 2 weeks postpartum.[2][4] Among women of reproductive age hospitalized with influenza over nine U.S. seasons, nearly 28% were pregnant, and 62% were in their third trimester.[2] Influenza during pregnancy is associated with adverse birth outcomes including preterm birth (aHR 1.34), low birthweight (aHR 1.40), and late pregnancy loss (aHR 10.7).[6][7] Maternal influenza vaccination reduces the hazard of low birthweight (aHR 0.84), preterm birth (aHR 0.83), and extreme preterm birth (aHR 0.59).[6]
Chronic Medical Conditions
The CDC/ACIP identifies the following chronic conditions as risk factors for influenza complications:[1][8]
- Pulmonary disease: Asthma is the most common underlying condition among children hospitalized with influenza (24–28% of pediatric hospitalizations). COPD and cystic fibrosis also confer increased risk.[3]
- Cardiovascular disease (excluding isolated hypertension): Congestive heart failure has the highest adjusted rate ratio for influenza-associated hospitalization among specific conditions (aRR 4.2; 95% CI 3.6–4.9) in a recent retrospective cohort study.[9] Influenza is a potent trigger for acute cardiovascular events. A landmark self-controlled case series found a 6-fold increased incidence of acute myocardial infarction within 7 days of laboratory-confirmed influenza (incidence ratio 6.05; 95% CI 3.86–9.50), with highest risk in the first 3 days.[10] A 2025 meta-analysis confirmed moderate-certainty evidence that influenza triggers AMI (IRR 5.37; 95% CI 3.48–8.28) and high-certainty evidence for stroke (IRR 4.72; 95% CI 3.78–5.90).[11]
- Diabetes mellitus: A meta-analysis of 34 observational studies found that mortality and hospitalization for influenza and pneumonia were significantly higher in individuals with versus without diabetes.[12] Among adults ≥65 years with diabetes, influenza-associated hospitalization rates were 57% higher (RR 1.57; 95% CI 1.43–1.72) compared with those without diabetes.[13]
- Chronic kidney disease: CKD is associated with more severe influenza illness and higher complication rates.[14] KDIGO recommends annual influenza vaccination for all persons with CKD.[15]
- Hepatic disease: Patients with liver disease, particularly cirrhosis, have impaired immune function and are at increased risk for influenza-related hospitalization and death. During the 2009 H1N1 pandemic, patients with liver disease had a >5-fold increased risk of hospitalization and 17-fold increased risk of death compared with healthy individuals.[16]
- Neurologic and neurodevelopmental conditions: These include cerebral palsy, epilepsy, stroke, intellectual disability, muscular dystrophy, spinal cord injury, and conditions that compromise respiratory function or handling of secretions.[8] Among hospitalized children, pre-existing neurologic conditions confer a 3.7-fold increased odds of neurologic complications (aOR 3.7; 95% CI 3.1–4.2), including encephalopathy, seizures, and encephalitis.[17]
- Hematologic disorders: Sickle cell disease and other hemoglobinopathies increase the risk of influenza complications.[8]
- Metabolic disorders: Including inherited metabolic disorders and mitochondrial disorders.[8]
- Heavy alcohol use is associated with increased mortality risk from influenza.[18]
Cumulative Risk of Multiple Comorbidities
The cumulative number of CDC-defined high-risk conditions is a strong predictor of influenza-related medical encounters. A 2024 study found that the odds of influenza-related hospitalization increased progressively with each additional high-risk condition: OR 1.8 for 1 risk factor, OR 3.4 for 2 risk factors, and OR 6.4 for ≥4 risk factors.[19] A 2025 study confirmed that adjusted rate ratios for influenza-associated hospitalization increased with each additional underlying medical condition, and that hospitalization rates would have been approximately 60% higher without vaccination.[9]
Obesity
Extreme obesity (BMI ≥40 kg/m²) is recognized by the CDC/ACIP as a risk factor for severe influenza.[1] A prospective cohort study found that obese adults (BMI 30–40) had 27% higher influenza incidence (aHR 1.27) and 57% higher hospitalization risk (aHR 1.57), while very obese adults (BMI 40–50) had 69% higher incidence and nearly 5-fold higher hospitalization risk (aHR 4.81).[20] Obesity dysregulates pulmonary antiviral immune responses and is the third most common underlying condition among children hospitalized with influenza (13–16%), associated with worse prognosis including ICU admission and death.[5]
Immunocompromised States
Immunosuppression from any cause increases the risk of severe influenza, prolonged viral shedding, nosocomial transmission, and antiviral resistance.[1][21] Among 35,348 adults hospitalized with influenza (2011–2015), 10% were immunocompromised. After adjustment, immunocompromised adults had 46% higher mortality (aOR 1.46; 95% CI 1.20–1.76), longer hospitalization, and higher rates of mechanical ventilation (aOR 1.19).[21] Immunocompromised patients may have atypical presentations (absence of fever) and prolonged viral shedding, facilitating nosocomial transmission.[22]
Aspirin/Salicylate Use in Children and Adolescents
Children and adolescents aged 6 months through 18 years receiving aspirin- or salicylate-containing medications are at risk for Reye syndrome following influenza infection.[1][8] Reye syndrome is characterized by encephalopathy and fatty degeneration of the liver, typically following influenza or varicella. Historical data (1981–1997) reported a case fatality rate of 31%; modern rates may differ given improved ICU care and the rarity of the condition, though no updated large-scale data exist.[23] Only inactivated influenza vaccine should be administered to children on chronic aspirin therapy.[24]
Genetic Susceptibility
Host genetic factors contribute to variability in influenza severity, though their clinical utility for risk stratification remains limited. The IFITM3 rs12252-C polymorphism is the most consistently replicated genetic risk factor, with a meta-analysis showing an overall OR of 1.52 (95% CI 1.06–2.17) for severe influenza, though effects vary by ethnicity.[25][26] Other implicated genes include TMPRSS2 (viral entry), IRF7/IRF9 (interferon signaling), and pulmonary surfactant-associated proteins.[2][27]
Neurologic Complications in Previously Healthy Children
During the 2024–2025 season, 109 cases of influenza-associated encephalopathy (IAE) were identified, with 41% mortality among acute necrotizing encephalopathy (ANE) cases. Notably, 55% of children with IAE were previously healthy, and only 16% had received the influenza vaccine.[28][5] This demonstrates that severe neurologic complications can occur in otherwise healthy children and underscores the importance of universal pediatric vaccination.
Demographic and Socioeconomic Risk Factors
Race and Ethnicity
Significant racial and ethnic disparities exist in influenza severity in the United States.[29][30] From 2009–2019, age-adjusted influenza hospitalization rates were highest among Black persons (68.8 per 100,000), followed by American Indian/Alaska Native, Hispanic, and White persons.[30] Among children ≤4 years, hospitalization rates were 2–3 times higher in Black (RR 2.21), Hispanic (RR 1.87), and American Indian/Alaska Native (RR 3.00) children compared with White children. In-hospital death rates were 3–4 times higher in Black, Hispanic, and Asian/Pacific Islander children.[5][30] The CDC now explicitly identifies Black, Hispanic, and American Indian/Alaska Native persons as populations disproportionately affected by severe influenza.[4]
Socioeconomic Status and Poverty
Influenza hospitalization rates increase with increasing census tract poverty across all ages and racial/ethnic groups. In a FluSurv-NET analysis, hospitalization rates in high-poverty census tracts were nearly 2-fold the rates in low-poverty census tracts.[30]
Behavioral and Environmental Risk Factors
Smoking
Smoking is associated with increased risk of influenza acquisition and severity. A meta-analysis of 12 studies found that ever-active smokers had higher odds of influenza-associated hospital admission (OR 1.5; 95% CI 1.3–1.7) and ICU admission (OR 2.2; 95% CI 1.4–3.4) compared with never smokers.[31]
Congregate Settings and Occupational Exposure
- Healthcare workers are at increased risk of influenza exposure through daily patient contact. ACIP recommends annual vaccination for all healthcare personnel.[1]
- Household contacts and caregivers of high-risk persons are explicitly listed by ACIP as a priority group for vaccination to reduce transmission to vulnerable individuals.[1]
- Nursing home and long-term care facility residents are at high risk for both exposure and severe outcomes due to advanced age, comorbidities, and congregate living. During the 2024–2025 season, influenza vaccination coverage was only 61.3% among nursing home residents and 42.1% among nursing home healthcare personnel.[32]
- Daycare settings facilitate transmission among young children, who are efficient spreaders of influenza.[18]
Travel
Influenza is among the most prevalent infectious diseases in travelers. Risk is increased during cruise ship travel, mass gatherings, and air travel.[33] Modern aircraft HEPA filtration systems capture 99.97% of particles ≥0.3 µm, but close proximity of passengers still permits person-to-person transmission, particularly during boarding, deplaning, and ground delays when ventilation may be reduced.[34]
Lack of Vaccination as a Risk Factor
Absence of influenza vaccination is a modifiable risk factor for severe disease. Influenza vaccination reduces the risk of hospitalization, ICU admission, and death among individuals who develop influenza.[35][36] During the 2024–2025 high-severity season, 89% of vaccine-eligible children who died from influenza were not fully vaccinated.[5]
Clinically Actionable Recommendations
- Identify high-risk patients at every clinical encounter. The ACIP high-risk list should be used to guide vaccination prioritization and early antiviral treatment decisions.[1]
- Vaccinate all persons ≥6 months without contraindications annually, with particular emphasis on high-risk groups and their household contacts/caregivers.[1]
- Initiate antiviral treatment empirically in high-risk patients with suspected influenza without waiting for confirmatory testing. Treatment should be started “as soon as possible” and is most effective within 48 hours of symptom onset; however, for high-risk patients, treatment should not be withheld even if >48 hours from symptom onset.[4][5][37]
- Screen for aspirin/salicylate use in children and adolescents with influenza; consider alternative antipyretics and ensure only inactivated influenza vaccine is administered.[23][24]
High-Yield Clinical Pearls
- The ACIP high-risk list is the foundation for clinical decision-making regarding vaccination prioritization and empiric antiviral treatment. All persons aged ≥50 years are considered high-risk.
- Influenza triggers AMI within 7 days (6-fold risk) and stroke within 28 days (4.7-fold risk).
- Congestive heart failure has the highest adjusted rate ratio for influenza-associated hospitalization among specific conditions (aRR 4.2).
- Approximately 44% of children who die from influenza have no underlying medical conditions (varies by season; range 39–57%), underscoring the importance of universal pediatric vaccination.
- Immunocompromised patients may present without fever and shed virus for prolonged periods, facilitating nosocomial transmission.
- Infants <6 months have the highest hospitalization and mortality rates but are too young for vaccination — cocooning through household vaccination is critical.
- Extreme obesity (BMI ≥40) independently increases the risk of severe influenza.
- Racial/ethnic disparities in influenza severity persist even after adjusting for insurance and healthcare access.
- During the 2024–2025 season, 55% of children with influenza-associated encephalopathy (IAE) were previously healthy, and only 16% had received the influenza vaccine.
References
- ↑ 1.00 1.01 1.02 1.03 1.04 1.05 1.06 1.07 1.08 1.09 1.10 Grohskopf LA, Blanton LH, Ferdinands JM; et al. (2022). “Prevention and Control of Seasonal Influenza With Vaccines: Recommendations of the Advisory Committee on Immunization Practices – United States, 2022-23 Influenza Season”. MMWR Recomm Rep. 71 (1): 1–28. doi:10.15585/mmwr.rr7101a1.
- ↑ 2.0 2.1 2.2 2.3 2.4 Uyeki TM, Hui DS, Zambon M, Wentworth DE, Monto AS (2022). “Influenza”. Lancet. 400 (10353): 693–706. doi:10.1016/S0140-6736(22)00982-5. PMID 36001333 Check
|pmid=value (help). - ↑ 3.0 3.1 Naquin A, O’Halloran A, Ujamaa D; et al. (2024). “Laboratory-Confirmed Influenza-Associated Hospitalizations Among Children and Adults – Influenza Hospitalization Surveillance Network, United States, 2010-2023”. MMWR Surveill Summ. 73 (6): 1–18. doi:10.15585/mmwr.ss7706a1.
- ↑ 4.0 4.1 4.2 4.3 Molly Valleau and Christine M. Szablewski. Influenza. CDC Yellow Book.
- ↑ 5.0 5.1 5.2 5.3 5.4 5.5 5.6 Committee on Infectious Diseases (2025). “Recommendations for Prevention and Control of Influenza in Children, 2025-2026: Technical Report”. Pediatrics. doi:10.1542/peds.2025-073622.
- ↑ 6.0 6.1 Zhang X, Balasubramani GK, D’Agostino HEA, Liu H, Rick AM (2026). “The Impact of Maternal Influenza Infection and Vaccination During Pregnancy on Birth Outcomes”. Pediatr Infect Dis J. doi:10.1097/INF.0000000000005194.
- ↑ Dawood FS, Kittikraisak W, Patel A; et al. (2021). “Incidence of influenza during pregnancy and association with pregnancy and perinatal outcomes in three middle-income countries: a multisite prospective longitudinal cohort study”. Lancet Infect Dis. 21 (1): 97–106. doi:10.1016/S1473-3099(20)30592-2.
- ↑ 8.0 8.1 8.2 8.3 8.4 Committee on Infectious Diseases (2019). “Recommendations for Prevention and Control of Influenza in Children, 2019-2020”. Pediatrics. 144 (4): e20192478. doi:10.1542/peds.2019-2478.
- ↑ 9.0 9.1 Frutos AM, O’Halloran A; et al. (2025). “Influenza-Associated Hospitalization Rates by Underlying Medical Conditions, United States, 2010-2023”. J Infect Dis. doi:10.1093/infdis/jiafXXX.
- ↑ Kwong JC, Schwartz KL, Campitelli MA; et al. (2018). “Acute Myocardial Infarction after Laboratory-Confirmed Influenza Infection”. N Engl J Med. 378 (4): 345–353. doi:10.1056/NEJMoa1702090.
- ↑ Nguyen TQ, Vlasenko D, Shetty AN; et al. (2025). “Systematic Review and Meta-Analysis of Respiratory Viral Triggers for Acute Myocardial Infarction and Stroke”. Cardiovasc Res. doi:10.1093/cvr/cvaf092.
- ↑ Dicembrini I, Silverii GA, Clerico A; et al. (2023). “Influenza: diabetes as a risk factor for severe related-outcomes and the effectiveness of vaccination in diabetic population. A meta-analysis of observational studies”. Nutr Metab Cardiovasc Dis. 33 (6): 1099–1110. doi:10.1016/j.numecd.2023.03.016.
- ↑ Owusu D, Rolfes MA, Arriola CS; et al. (2022). “Rates of Severe Influenza-Associated Outcomes Among Older Adults Living With Diabetes-Influenza Hospitalization Surveillance Network (FluSurv-NET), 2012-2017”. Open Forum Infect Dis. 9 (5): ofac131. doi:10.1093/ofid/ofac131.
- ↑ Lees JS, Škoberne A, Zhang L; et al. (2026). “Chronic kidney disease, complex conditions, and advancing therapeutics: new hope and challenges”. Lancet. 407 (10546): 2444–2460. doi:10.1016/S0140-6736(26)00653-7.
- ↑ Bartholdy KV, Johansen ND, Modin D; et al. (2025). “High-Dose vs Standard-Dose Influenza Vaccine in Chronic Kidney Disease: The DANFLU-2 Trial Subgroup Analysis”. J Am Coll Cardiol. 86 (25): 2636–2647. doi:10.1016/j.jacc.2025.10.005.
- ↑ Stroffolini T, Lombardi A, Ciancio A; et al. (2021). “Low influenza vaccination coverage in subjects with liver cirrhosis. An alert waiting for winter season 2020-2021 during the COVID-19 pandemic”. J Med Virol. 93 (4): 2446–2452. doi:10.1002/jmv.26763.
- ↑ Antoon JW, Hall M, Herndon A; et al. (2021). “Prevalence, Risk Factors, and Outcomes of Influenza-Associated Neurologic Complications in Children”. J Pediatr. 239: 32–38.e5. doi:10.1016/j.jpeds.2021.06.075.
- ↑ 18.0 18.1 Paules C, Subbarao K (2017). “Influenza”. Lancet. 390 (10095): 697–708. doi:10.1016/S0140-6736(17)30129-0.
- ↑ McGovern I; et al. (2024). “Number of CDC-Defined High-Risk Conditions and Influenza-Related Outcomes”. Open Forum Infect Dis. doi:10.1093/ofid/ofadXXX.
- ↑ Karki S, Muscatello DJ, Banks E; et al. (2018). “Association Between Body Mass Index and Laboratory-Confirmed Influenza in Middle Aged and Older Adults: A Prospective Cohort Study”. Int J Obes (Lond). 42 (8): 1480–1488. doi:10.1038/s41366-018-0029-x.
- ↑ 21.0 21.1 Collins JP, Campbell AP, Openo K; et al. (2020). “Outcomes of Immunocompromised Adults Hospitalized With Laboratory-Confirmed Influenza in the United States, 2011-2015”. Clin Infect Dis. 70 (10): 2121–2130. doi:10.1093/cid/ciz638.
- ↑ Liu Y, Wang Y, Mai H; et al. (2022). “Clinical characteristics, risk factors and antiviral treatments of influenza in immunosuppressed inpatients in Beijing during the 2015-2020 influenza seasons”. Virol J. 19 (1): 11. doi:10.1186/s12985-021-01739-1.
- ↑ 23.0 23.1 Belay ED, Bresee JS, Holman RC; et al. (1999). “Reye’s Syndrome in the United States from 1981 through 1997”. N Engl J Med. 340 (18): 1377–82. doi:10.1056/NEJM199905063401801.
- ↑ 24.0 24.1 McCrindle BW, Rowley AH, Newburger JW; et al. (2017). “Diagnosis, Treatment, and Long-Term Management of Kawasaki Disease: A Scientific Statement for Health Professionals From the American Heart Association”. Circulation. 135 (17): e927–e999. doi:10.1161/CIR.0000000000000484.
- ↑ Van Goethem N, Danwang C, Bossuyt N; et al. (2021). “A systematic review and meta-analysis of host genetic factors associated with influenza severity”. BMC Genomics. 22 (1): 912. doi:10.1186/s12864-021-08240-7.
- ↑ Prabhu SS, Chakraborty TT, Kumar N, Banerjee I (2018). “Association between IFITM3 rs12252 polymorphism and influenza susceptibility and severity: A meta-analysis”. Gene. 674: 70–79. doi:10.1016/j.gene.2018.06.070.
- ↑ Clohisey S, Baillie JK (2019). “Host susceptibility to severe influenza A virus infection”. Crit Care. 23 (1): 303. doi:10.1186/s13054-019-2566-7.
- ↑ CDC (2025). “Influenza-Associated Encephalopathy in Children — United States, 2024–2025”. MMWR Morb Mortal Wkly Rep. doi:10.15585/mmwr.mm74XX.
- ↑ Black CL, O’Halloran A, Hung MC; et al. (2022). “Vital Signs: Influenza Hospitalizations and Vaccination Coverage by Race and Ethnicity-United States, 2009-10 Through 2021-22 Influenza Seasons”. MMWR Morb Mortal Wkly Rep. 71 (43): 1366–1373. doi:10.15585/mmwr.mm7143e1.
- ↑ 30.0 30.1 30.2 30.3 O’Halloran AC, Holstein R, Cummings C; et al. (2021). “Rates of Influenza-Associated Hospitalization, Intensive Care Unit Admission, and In-Hospital Death by Race and Ethnicity in the United States From 2009 to 2019”. JAMA Netw Open. 4 (8): e2121880. doi:10.1001/jamanetworkopen.2021.21880.
- ↑ Han L, Ran J, Mak YW; et al. (2019). “Smoking and Influenza-Associated Morbidity and Mortality: A Systematic Review and Meta-Analysis”. Epidemiology. 30 (3): 405–417. doi:10.1097/EDE.0000000000000984.
- ↑ Bell JM, Barbre K, Meng L; et al. (2026). “Influenza Vaccination Coverage Among Nursing Home Residents and Health Care Personnel – United States, 2024-25 Influenza Season”. MMWR Morb Mortal Wkly Rep. 75 (15): 195–201. doi:10.15585/mmwr.mm7515a1.
- ↑ Goeijenbier M, van Genderen P, Ward BJ; et al. (2017). “Travellers and influenza: risks and prevention”. J Travel Med. 24 (1): taw078. doi:10.1093/jtm/taw078.
- ↑ Sundari R Mase, Shannon L. Gearhart, Edward A. Nardell, and Clive M. Brown. Air Travel. CDC Yellow Book.
- ↑ Yegorov S, Patel OD, Sharma H; et al. (2025). “Effectiveness of influenza vaccination to prevent severe disease: a systematic review and meta-analysis of test-negative design studies”. Clin Microbiol Infect. doi:10.1016/j.cmi.2025.09.023.
- ↑ Ferdinands JM, Thompson MG, Blanton L; et al. (2021). “Does influenza vaccination attenuate the severity of breakthrough infections? A narrative review and recommendations for further research”. Vaccine. 39 (28): 3678–3695. doi:10.1016/j.vaccine.2021.05.011.
- ↑ Uyeki TM; et al. (2020). “Influenza”. JAMA. doi:10.1001/jama.2020.14772.
Editor-In-Chief: C. Michael Gibson, M.S., M.D. [1] Associate Editor(s)-in-Chief: Mohammad Braizat, M.S. [2]
Natural History, Complications and Prognosis
Overview
The incubation period of influenza is 1 to 4 days. Uncomplicated influenza can present with constitutional symptoms and can resolve within 3-7 days; while more complex disease may be observed with patients developing pneumonia, otitis, encephalitis and sepsis.
Natural History
Transmission
- Influenza viruses are spread from person to person primarily through large-particle respiratory droplet transmission
- Contact with respiratory-droplet contaminated surfaces is another possible source of transmission.
- Airborne transmission (via small-particle residue [less than or equal to 5µm] of evaporated droplets that might remain suspended in the air for long periods of time) also is thought to be possible, although data supporting airborne transmission are limited.
Incubation Period
- The typical incubation period for influenza is 1-4 days (average: 2 days).
- Adults shed influenza virus from the day before symptoms begin through 5-10 days after illness onset.
- Young children also might shed virus several days before illness onset, and children can be infectious for 10 or more days after onset of symptoms. Severely immunocompromised persons can shed virus for weeks or months.
Progression
- Uncomplicated influenza illness is characterized by the abrupt onset of constitutional and respiratory signs and symptoms (e.g., fever, myalgia, headache, malaise, nonproductive cough, sore throat, and rhinitis).
- Among children,otitis media, nausea, and vomiting also are commonly reported with influenza illness.
- Uncomplicated influenza illness typically resolves after 3-7 days for the majority of persons, although cough and malaise can persist for >2 weeks.
- Influenza virus infections can cause primary influenza viral pneumonia; exacerbate underlying medical conditions (e.g., pulmonary or cardiac disease); lead to secondary bacterial pneumonia, sinusitis, or otitis media; or contribute to coinfections with other viral or bacterial pathogens.
- Young children with influenza virus infection might have initial symptoms mimicking bacterial sepsis with high fever, and febrile seizures have been reported in 6%-20% of children hospitalized with influenza virus infection.
- Influenza virus infection also has been uncommonly associated with encephalopathy, transverse myelitis, myositis, myocarditis, pericarditis, and Reye syndrome.
- Respiratory illnesses caused by influenza virus infection are difficult to distinguish from illnesses caused by other respiratory pathogens on the basis of signs and symptoms alone.
- Young children are less likely to report typical influenza symptoms (e.g., fever and cough).
- In the United States, annual epidemics of influenza typically occur during the fall or winter months, but the peak of influenza activity can occur as late as April or May
- Influenza-related complications requiring urgent medical care, including hospitalizations or deaths, can result from the direct effects of influenza virus infection, from complications associated with age or pregnancy, or from complications of underlying cardiopulmonary conditions or other chronic diseases.
- Influenza viruses cause disease among persons in all age groups.
- Rates of infection are highest among children, but the risks for complications, hospitalizations, and deaths from influenza are higher among persons aged 65 years and older, young children, and persons of any age who have medical conditions that place them at increased risk for complications from influenza.
Complications
Possible complications of influenza, especially for those at high risk, include:
Prognosis
Anyone at any age can have serious complications from the flu, but those at highest risk include:
- People over age 50
- Children between 6 months and 2 years
- Women more than 3 months pregnant during the flu season
- Anyone living in a long-term care facility
- Anyone with chronic heart, lung, or kidney conditions, diabetes, or a weakened immune system
In most individuals who are otherwise healthy, the flu goes away within 7 to 10 days.[1]
References
Editor-In-Chief: For more information about non-human (variant) influenza viruses that may be transmitted to humans, see Zoonotic influenza
C. Michael Gibson, M.S., M.D. [1]; Associate Editor(s)-in-Chief: ; Ammu Susheela, M.D. [2]
Diagnosis
Diagnosis
History and Symptoms | Physical Examination | Laboratory Findings | Chest X Ray | Other Diagnostic Studies
Treatment
Treatment
Medical Therapy | Primary Prevention | Cost-Effectiveness of Therapy | Future or Investigational Therapies
Related Chapters
Related Chapters
- Information concerning flu research can be found at
- Influenza research
- H5N1 clinical trials
- Center for Biologics Evaluation and Research
- H5N1 genetic structure
- ICEID
- Influenza Genome Sequencing Project
- Cytokine storm
- International Partnership on Avian and Pandemic Influenza
- National Influenza Centers
- Pandemic Preparedness and Response Act
- Global Alliance for Vaccines and Immunization
- IFPMA International Federation of Pharmaceutical Manufacturers Associations
- Reporting disease cases
- Original antigenic sin
- Center for Biologics Evaluation and Research
- ICEID
- Influenza Genome Sequencing Project
- Cytokine storm
- International Partnership on Avian and Pandemic Influenza
- National Influenza Centers
- Pandemic Preparedness and Response Act
Further Readings
Further Readings
|
Template:Col-1-of-2General
|
External Links
External Links
- Info on influenza at CDC
- Fact Sheet Overview of influenza at World Health Organization
- Orthomyxoviridae The Universal Virus Database of the International Committee on Taxonomy of Viruses
- Influenza Virus Resource from the NCBI
Template:Respiratory pathology Template:Viral diseases
ar:فيروس إنفلونزا bg:Грип ca:Grip cs:Chřipka cy:Y ffliw da:Influenza de:Influenza el:Γρίπη eo:Gripo eu:Gripe fa:آنفلوآنزا fi:Influenssa gl:Gripe he:שפעת hr:Gripa id:Influensa io:Influenzo it:Influenza kk:Тұмау ko:인플루엔자 lv:gripa hu:Influenza nl:Griep nn:Influensa no:Influensa simple:Influenza sk:Chrípka sl:Gripa sr:Грип sq:Gripi sv:Influensa th:ไข้หวัดใหญ่ wa:Virûsse del gripe yi:פלו zh-min-nan:Liû-hêng-sèng kám-mō͘
Editor-In-Chief: C. Michael Gibson, M.S., M.D. [1]; Associate Editor(s)-in-Chief: Alejandro Lemor, M.D. [2]; Ammu Susheela, M.D. [3]