
Influenza
For patient information click here
For more information about non-human (variant) influenza viruses that may be transmitted to humans, see Zoonotic influenza
Editor-In-Chief: C. Michael Gibson, M.S., M.D. [1]; Associate Editor(s)-in-Chief: Alejandro Lemor, M.D. [2]; Ammu Susheela, M.D. [3]
Synonyms and keywords: Flu; influenza A; influenza B; influenza C; human influenza; human influenza virus
Overview
For more information about non-human (variant) influenza viruses that may be transmitted to humans, see Zoonotic influenza
Editor-In-Chief: C. Michael Gibson, M.S., M.D. [1]; Associate Editor(s)-in-Chief: Alejandro Lemor, M.D. [2]
Overview
Influenza, commonly known as flu, is an infectious disease of birds and mammals caused by RNA viruses of the biological family Orthomyxoviridae (the influenza viruses). In humans, common symptoms of influenza infection are fever, sore throat, muscle pains, severe headache, coughing, weakness and general discomfort.[1] In more serious cases, influenza causes pneumonia, which can be fatal, particularly in young children and the elderly. Sometimes confused with the common cold, influenza is a much more severe disease and is caused by a different type of virus.[2] Although nausea and vomiting can be produced, especially in children,[1] these symptoms are more characteristic of the unrelated gastroenteritis.[3]
Historical Perspective
Influenza-like symptoms have been reported for many thousandth of years, but the first pandemic outbreak was in Asia, Europe and Africa in 1580. Since then, several outbreaks have been reported, including the Spanish flu pandemic in 1918, the Asian flu pandemic in 1957, and the Hong Kong flu pandemic in 1968. The first vaccine against influenza was developed in 1940s to prevent the US military to develop the disease in World War II.
Classification
Influenza virus can be classified into 3 main types: A, B and C. Based on the surface glycoproteins, hemagglutinin (HA) and neuraminidase (NA), influenza type A is subclassified into several subtypes and can infect many species, including humans. Type B can only infect humans and type C is not that common and causes mild illness.
Pathophysiology
Influenza virus is under constant evolutionary change. These genetic changes may be small and continuous or large and abrupt. Small genetic changes happen continuously in Type A and Type B influenza as the virus makes copies of itself. This process is called antigenic drift. Drifting happens frequently enough to make new strains of virus unrecognizable to the human immune system. Type A influenza also undergoes infrequent and sudden changes known as antigenic shift. Antigenic shift occurs when two different flu strains infect the same cell and combine portions of their genetic material. The novel assortment of HA and/or NA proteins in a shifted virus may create a new influenza A subtype. Influenza viruses spread mainly through tiny droplets expelled when people with the disease cough, sneeze, or talk. These droplets can land in the mouths or noses of people who are nearby or be inhaled into the lungs.
Causes
Influenza infection is caused by the influenza virus that belong to the family Orthomyxoviridae. Three types of influenza virus have been reported to cause clinical illness in humans: types A, B, and C. Influenza virus can be found in humans, as well as in poultry, pigs, and bats.
Differentiating Influenza from other Diseases
Influenza should be differentiated from other conditions that cause fever, cough, myalgias, headache and fatigue, such as RSV infection, dengue fever, parainfluenza virus infection, ebola infection adenovirus infection, rhinovirus infection, and legionella infection.
Epidemiology and Demographics
The CDC estimates that 5 to 20 percent of Americans are affected by the flu during each flu season, which typically lasts from October to March. Children are 2 to 3 times more likely than adults to get sick with the flu, and children frequently spread the virus to others. For elderly people, newborn babies, pregnant women, and people with certain chronic illnesses, the flu and its complications can be life-threatening. Although most people recover from the illness, between 3,000 and 49,000 US citizens die from the flu and its complications every year.[4]
Risk Factors
Risk factors for influenza are for those patients that are exposed to the disease, such as healthcare workers, residents of nursing homes or children. However, there are certain groups that are at risk for severe disease and complications, such as children younger than 2 years old, adults aged 65 or older, pregnant women, patients with comorbidities, asthmatic patients, and patients with a weakened immune system.
Natural History, Complications and Prognosis
Influenza is a viral respiratory infection spread from person to person chiefly through droplet transmission. The incubation period period is 1 to 4 days. The uncomplicated influenza can present with constitutional symptoms and can resolve in 3-7 days; while others can develop into pneumonia, ear infection, encephalitis and sepsis.
Diagnosis
History and Symptoms
Influenza illness can include several non-specific symptoms, such as fever, muscle aches, headache, lack of energy, dry cough, sore throat, and runny nose. The fever and body aches can last 3-5 days and the cough and lack of energy may last for 2 or more weeks. The symptoms of the flu are more severe than their common-cold equivalents.
Physical Examination
During the physical examination in a patient with influenza, findings can include fever, tachycardia, tachypnea, sore throat, and fatigue. Complications can worsen the patient’s condition and findings in the lung examination may include dry cough, rales and focal wheezing.
Laboratory Findings
Diagnostic tests available for influenza include viral culture, serology, rapid antigen testing, polymerase chain reaction (PCR), immunofluorescence assays, and rapid molecular assays. Sensitivity and specificity of any test for influenza might vary by the laboratory that performs the test, the type of test used, and the type of specimen tested. Among respiratory specimens for viral isolation or rapid detection, nasopharyngeal specimens are typically more effective than throat swab specimens. As with any diagnostic test, results should be evaluated in the context of other clinical and epidemiologic information available to health-care providers.
Chest X Ray
Chest X-ray is not routinely done in patients with influenza. A chest X-ray is useful to assess complications of influenza infection, such as a superimposed bacterial pneumonia.
Other Diagnostic Studies
Other diagnostic test for influenza include molecular assays, such as RT-PCR. New technologies being pursued include those that examine influenza viruses at the molecular level. By examining the genetic makeup of influenza viruses, such tests could identify both the virus type and subtype simultaneously.
Treatment
Medical Therapy
Antiviral drugs can diminish symptoms and shorten the time of the disease by 1 or 2 days. They also can prevent serious flu complications, such as pneumonia. For people with a high risk medical condition, treatment with an antiviral drug can mean the difference between having milder illness instead of very serious illness that could result in a hospital stay. The two main antivirals used in the treatment and prevention of influenza are oseltamivir and zanamivir. Symptomatic therapy is also important to overcome the symptoms of influenza, this include analgesics, antihistamines, decongestants and cough suppressants.
Primary Prevention
Vaccination and chemoprophylaxis are the two most important methods for preventing influenza among patients. Routine annual influenza vaccination is recommended for all persons aged ≥6 months who do not have contraindications. Annual influenza vaccination is the best way to prevent influenza because vaccination can be given well before influenza virus exposures occur, and can provide safe and effective immunity throughout the influenza season. Chemoprophylaxis is not recommended in all patients and should only be administered for certain populations who are at risk of complications.
Cost-Effectiveness of Therapy
Influenza produces direct costs due to lost productivity and associated medical treatment, as well as indirect costs of preventative measures. In the United States, influenza is responsible for a total cost of over $10 billion per year, while it has been estimated that a future pandemic could cause hundreds of billions of dollars in direct and indirect costs. However, the economic impact of past pandemics have not been intensively studied, and some authors have suggested that the Spanish influenza actually had a positive long-term effect on per-capita income growth, despite a large reduction in the working population and severe short-term depressive effects.[5] Other studies have attempted to predict the costs of a pandemic as serious as the 1918 Spanish flu on the U.S. economy, where 30% of all workers became ill, and 2.5% were killed. A 30% sickness rate and a three-week length of illness would decrease gross domestic product by 5%. Additional costs would come from medical treatment of 18 million to 45 million people, and total economic costs would be approximately $700 billion.[6]
Future or Investigational Therapies
Other antiviral drugs are being developed to treat influenza infection, such as peramivir. Vaccines are manufactured every year according to the subtype of influenza virus that causes the outbreak in that specific year.
References
- ↑ 1.0 1.1 Merck Manual Home Edition. “Influenza: Viral Infections”.
- ↑ Eccles, R (2005). “Understanding the symptoms of the common cold and influenza”. Lancet Infect Dis. 5 (11): 718–25. PMID 16253889.
- ↑ Seasonal Flu vs. Stomach Flu by Kristina Duda, R.N.; accessed March 12, 2007 (Website: “About, Inc., A part of The New York Times Company”)
- ↑ “National Institute of Allergy and Infectious Diseases – Flu Overview”.
- ↑ Brainerd, E. and M. Siegler (2003), “The Economic Effects of the 1918 Influenza Epidemic”, CEPR Discussion Paper, no. 3791.
- ↑ Poland G (2006). “Vaccines against avian influenza—a race against time”. N Engl J Med. 354 (13): 1411–3. PMID 16571885.
Historical Perspective
For more information about non-human (variant) influenza viruses that may be transmitted to humans, see Zoonotic influenza
Editor-In-Chief: C. Michael Gibson, M.S., M.D. [1]; Associate Editor(s)-in-Chief: Alejandro Lemor, M.D. [2]
Overview
Influenza-like symptoms have been reported for thousands of years, but the first pandemic outbreak recorded in Asia, Europe and Africa was in 1580. Since then, several outbreaks have been reported, including the Spanish flu pandemic of 1918 that killed 50 to 100 million patients, the Asian flu pandemic of 1957, and the Hong Kong flu pandemic of 1968. The first vaccine against influenza was developed in the 1940s to prevent outbreaks within the US military during World War II.
Historical Perspective
- The symptoms of human influenza were clearly described by Hippocrates roughly 2400 years ago.[1][2]
- Since then, the virus has caused numerous pandemics.
- Historical data on influenza are difficult to interpret, because the symptoms can be similar to those of other diseases, such as diphtheria, pneumonic plague, typhoid fever, dengue, or typhus.
- The first convincing record of an influenza pandemic was of an outbreak in 1580, which began in Asia and spread to Europe via Africa.
- In Rome over 8,000 people were killed, and several Spanish cities were almost wiped out.
- Pandemics continued sporadically throughout the 17th and 18th centuries, with the pandemic of 1830–1833 being particularly widespread; it infected approximately a quarter of the people exposed.[3]
 |
Spanish Flu Pandemic
- The most famous and lethal outbreak was the so-called Spanish flu pandemic (type A influenza, H1N1 subtype), which lasted from 1918 to 1919.
- Older estimates say it killed 40–50 million people[5] while current estimates say 50 million to 100 million people worldwide were killed.[6]
- This pandemic has been described as “the greatest medical holocaust in history” and may have killed as many people as the Black Death.[3]
- This huge death toll was caused by an extremely high infection rate of up to 50% and the extreme severity of the symptoms, suspected to be caused by cytokine storms.[5]
- Indeed, symptoms in 1918 were so unusual that initially influenza was misdiagnosed as dengue, cholera, or typhoid.
- The majority of deaths were from bacterial pneumonia, a secondary infection caused by influenza, but the virus also killed people directly, causing massive hemorrhages and edema in the lung.[4]
- The Spanish flu pandemic was truly global, spreading even to the Arctic and remote Pacific islands.
- The unusually severe disease killed between 2 and 20% of those infected, as opposed to the more usual flu epidemic mortality rate of 0.1%.[4][6]
- Another unusual feature of this pandemic was that it mostly killed young adults, with 99% of pandemic influenza deaths occurring in people under 65, and more than half in young adults 20 to 40 years old.[7]
- This is unusual since influenza is normally most deadly to the very young (under age 2) and the very old (over age 70).
- The total mortality of the 1918–1919 pandemic is not known, but it is estimated that 2.5% to 5% of the world’s population was killed. As many as 25 million may have been killed in the first 25 weeks; in contrast, HIV/AIDS has killed 25 million in its first 25 years.[6]
| Name of pandemic | Date | Deaths | Case fatality rate | Subtype involved | Pandemic Severity Index |
|---|---|---|---|---|---|
| 1889–1890 Flu Pandemic (Asiatic or Russian Flu)[10] |
1889–1890 | 1 million | 0.15% | possibly H3N8 or H2N2 |
N/A |
| 1918 Flu Pandemic (Spanish flu)[11] |
1918–1920 | 20 to 100 million | 2% | H1N1 | 5 |
| Asian Flu | 1957–1958 | 1 to 1.5 million | 0.13% | H2N2 | 2 |
| Hong Kong Flu | 1968–1969 | 0.75 to 1 million | <0.1% | H3N2 | 2 |
| Russian flu | 1977–1978 | no accurate count | N/A | H1N1 | N/A |
| 2009 Flu Pandemic[12] | 2009–2010 | 105,700-395,600[13] | 0.03% | H1N1 | N/A |
Other Flu Pandemics
- Later flu pandemics were not so devastating.
- They included the following:
- The 1957 Asian Flu (type A, H2N2 strain)
- The 1968 Hong Kong Flu (type A, H3N2 strain)
- Even these smaller outbreaks killed millions of people.
- In later pandemics antibiotics were available to control secondary infections and this may have helped reduce mortality compared to the Spanish Flu of 1918.[4]
- Although there were scares in New Jersey in 1976 (with the Swine Flu), world wide in 1977 (with the Russian Flu), and in Hong Kong and other Asian countries in 1997 (with H5N1 avian influenza), there have been no major pandemics since the 1968 Hong Kong Flu.
- Immunity to previous pandemic influenza strains and vaccination may have limited the spread of the virus and may have helped prevent further pandemics.[8]
Influenza Virus
- The etiology of influenza, the Orthomyxoviridae family of viruses, was first discovered in pigs by Richard Schope in 1931.[14]
- This discovery was shortly followed by the isolation of the virus from humans by a group headed by Patrick Laidlaw at the Medical Research Council of the United Kingdom in 1933.[15]
- However, it was not until Wendell Stanley first crystallized tobacco mosaic virus in 1935 that the non-cellular nature of viruses was appreciated.
Flu Vaccine
- The first significant step towards preventing influenza was the development in 1944 of a killed-virus vaccine for influenza by Thomas Francis, Jr.
- This built on work by Frank Macfarlane Burnet, who showed that the virus lost virulence when it was cultured in fertilized hen’s eggs.[16]
- Application of this observation by Francis allowed his group of researchers at the University of Michigan to develop the first flu vaccine, with support from the U.S. Army.[17]
- The Army was deeply involved in this research due to its experience of influenza in World War I, when thousands of troops were killed by the virus in a matter of months.[6]
Past Flu Seasons Adapted from CDC [18]
 |
 |
 Graph obtained from CDC MMWR on Influenza Activity |
 Graph obtained from CDC MMWR on Influenza Activity |
 Graph obtained from CDC MMWR on Influenza Activity |
 Graph obtained from CDC MMWR on Influenza Activity |
 Graph obtained from CDC MMWR on Influenza Activity |
2006-2007
- During October 1, 2006–May 19, 2007, the WHO and the National Respiratory and Enteric Virus Surveillance System (NREVSS) collaborating laboratories in the United States tested 179,268 respiratory specimens for influenza viruses; 23,753 (13.2%) were positive.
- Of these, 18,817 (79.2%) were influenza A viruses and 4,936 (20.8%) were influenza B viruses.
- Among the influenza A viruses, 6,280 (33.4%) were subtyped; 3,912 (62.3%) were influenza A (H1) viruses and 2,368 (37.7%) were influenza A (H3) viruses.
- The proportion of specimens testing positive for influenza first exceeded 10% during the week ending December 23, 2006 (week 51), peaked at 28.0% during the week ending February 10, 2007 (week 6), and declined to less than 10% during the week ending April 28, 2007 (week 17).
- The proportion was above 10% positive for 14 consecutive weeks.
- The peak percentage of specimens testing positive for influenza during the previous three seasons ranged from 22.6% to 34.7%, and the peak occurred during early December to early March.
- During the previous three influenza seasons, the number of consecutive weeks during which more than 10% of specimens tested positive for influenza ranged from 13 to 17 weeks.
2007-2008
- During September 30, 2007–May 17, 2008, the WHO and the National Respiratory and Enteric Virus Surveillance System collaborating laboratories in the United States tested 225,329 specimens for influenza viruses; 39,827 (18%) were positive.
- Of the positive specimens, 28,263 (71%) were influenza A viruses, and 11,564 (29%) were influenza B viruses.
- Among the influenza A viruses, 8,290 (29%) were subtyped; 2,175 (26%) were influenza A (H1N1), and 6,115 (74%) were influenza A (H3N2) viruses.
- The proportion of specimens testing positive for influenza first exceeded 10% during the week ending January 12, 2008 (week 2), peaked at 32% during the week ending February 9, 2008 (week 6), and declined to <10% during the week ending April 19, 2008 (week 16).
- The proportion positive was above 10% for 14 consecutive weeks.
- The peak percentage of specimens testing positive for influenza during the previous three seasons ranged from 22% to 34% and the peak occurred during mid-February to early March.
- During the previous three influenza seasons, the number of consecutive weeks during which more than 10% of specimens tested positive for influenza ranged from 13 to 17 weeks
2008-2009
- From September 28, 2008, to April 4, 2009, the (WHO) and the National Respiratory and Enteric Virus Surveillance System (NREVSS) collaborating laboratories in the United States tested 173,397 respiratory specimens for influenza viruses, 24,793 (14.3%) of which were positive.
- Of these, 16,686 (67.3%) were positive for influenza A viruses, and 8,107 (32.7%) were positive for influenza B viruses.
- Of the 16,686 specimens positive for influenza A viruses, 6,735 (40.4%) were subtyped by real-time reverse transcription-polymerase chain reaction or by virus culture; 6,049 (89.8%) of these were influenza A (H1N1) viruses, and 686 (10.2%) were influenza A (H3N2) viruses.
- The percentage of specimens testing positive for influenza first exceeded the seasonal threshold of 10% during the week ending January 17, 2009, and peaked at 25.0% during the week ending February 14, 2009.
- For the week ending April 4, 2009, 12.3% of specimens tested for influenza were positive.
- The relative proportion of influenza B viruses increased during February and March, and since the week ending March 14, 2009, >50% of the positive influenza specimens have been influenza B.
2009-2010
- Since April 2009, the beginning of the 2009 H1N1 pandemic, through June 12, 2010, approximately 740,000 influenza specimens were tested for influenza, and the number of laboratory-confirmed positives was approximately four times the average of the previous four seasons.
- Two peaks in percentage of specimens testing positive for influenza occurred: 43.1% in June during the initial pandemic wave, and 38.2% in October during the second wave.
- During August 30, 2009–June 12, 2010, the 2009–10 influenza season, the WHO and National Respiratory and Enteric Virus Surveillance System (NREVSS) collaborating laboratories in the United States tested 468,218 specimens for influenza viruses; 91,152 (19.5%) were positive.
- The proportion of specimens testing positive for influenza during the 2009–10 season exceeded 20% during the week ending August 30, 2009, peaked at 38.2% during the week ending October 24, and declined to less than 10% during the week ending December 12.
- Of the 91,152 positive specimens from 2009-10 season, 90,758 (99.6%) were influenza A viruses and 394 (0.4%) were influenza B viruses.
- Among the influenza A viruses, 67,022 (73.8%) were subtyped; 66,916 (99.8%) were 2009 pandemic H1N1, 72 (0.1%) were influenza A (H3N2), and 34 (0.1%) were seasonal influenza A (H1N1) viruses.
2010-2011
- During October 3, 2010–May 21, 2011, the WHO and National Respiratory and Enteric Virus Surveillance System (NREVSS) collaborating laboratories in the United States tested 246,128 specimens for influenza viruses; 54,226 (22%) were positive.
- Of the positive specimens, 40,282 (74%) were influenza A viruses, and 13,944 (26%) were influenza B viruses.
- Among the influenza A viruses, 28,545 (71%) were subtyped; 17,599(62%) were influenza A (H3N2) viruses, and 10,946 (38%) were 2009 influenza A (H1N1) viruses.
- The proportion of specimens testing positive for influenza during the 2010-11 season first exceeded 10%, indicating higher levels of virus circulation, during the week ending November 27, 2010.
- The proportion peaked at 36% during the week ending February 5, 2011, and declined to <10% during the week ending April 16, 2011.
2011-2012
- During October 2, 2011–May 19, 2012, the WHO) and National Respiratory and Enteric Virus Surveillance System (NREVSS) collaborating laboratories in the United States tested 169,453 specimens for influenza viruses; 22,417 (13%) were positive.
- Of the positive specimens, 19,285 (86%) were influenza A viruses, and 3,132 (14%) were influenza B viruses.
- Among the influenza A viruses, 14,968 (78%) were subtyped; 11,002 (74%) were influenza A (H3N2) viruses, and 3,966 (26%) were pH1N1 viruses.
- The proportion of specimens testing positive for influenza during the 2011–12 season first exceeded 10% (indicating higher levels of viral circulation) during the week ending February 4, 2012, and peaked at 32% during the week ending March 17, 2012.
2012-2013
- During September 30, 2012–May 18, 2013, the WHO and National Respiratory and Enteric Virus Surveillance System collaborating laboratories in the United States tested 311,333 specimens for influenza viruses; 73,130 (23%) were positive.
- Of the positive specimens, 51,675 (71%) were influenza A viruses, and 21,455 (29%) were influenza B viruses.
- Among the seasonal influenza A viruses, 34,922 (68%) were subtyped; 33,423 (96%) were influenza A (H3N2) viruses, and 1,497 (4%) were pH1N1 viruses.
- In addition, two variant influenza A (H3N2v) viruses were identified.
- Typically the influenza season is said to begin when certain key indicators remain elevated for a number of consecutive weeks.
- One of these indicators is the percent of respiratory specimens testing positive for influenza.
- The proportion of specimens testing positive for influenza during the 2012–13 season first exceeded 10% during the week ending November 10, 2012 (week 45), and peaked at 38% during the week ending December 29, 2012 (week 52).
References
- ↑ Martin, P (2006). “2,500-year evolution of the term epidemic”. Emerg Infect Dis. 12 (6). PMID 16707055. Unknown parameter
|coauthors=ignored (help); Unknown parameter|month=ignored (help) - ↑ Hippocrates (400 BCE). “Of the Epidemics”. Retrieved 2006-10-18. Unknown parameter
|coauthors=ignored (help); Check date values in:|date=(help) - ↑ 3.0 3.1 3.2 Potter, CW (2006). “A History of Influenza”. J Appl Microbiol. 91 (4): 572–579. PMID 11576290. Unknown parameter
|month=ignored (help) - ↑ 4.0 4.1 4.2 4.3
Taubenberger, J (2006). “1918 Influenza: the mother of all pandemics”. Emerg Infect Dis. 12 (1): 15–22. PMID 16494711. Unknown parameter
|coauthors=ignored (help) - ↑ 5.0 5.1 Patterson, KD (1991). “The geography and mortality of the 1918 influenza pandemic”. Bull Hist Med. 65 (1): 4–21. PMID 2021692. Unknown parameter
|month=ignored (help); Unknown parameter|coauthors=ignored (help) - ↑ 6.0 6.1 6.2 6.3 Knobler S, Mack A, Mahmoud A, Lemon S (ed.). “1: The Story of Influenza”. The Threat of Pandemic Influenza: Are We Ready? Workshop Summary (2005). Washington, D.C.: The National Academies Press. pp. 60–61.
- ↑ Simonsen, L (1998). “Pandemic versus epidemic influenza mortality: a pattern of changing age distribution”. J Infect Dis. 178 (1): 53–60. PMID 9652423. Unknown parameter
|month=ignored (help); Unknown parameter|coauthors=ignored (help) - ↑ 8.0 8.1 Hilleman, M (19 August 2002). “Realities and enigmas of human viral influenza: pathogenesis, epidemiology and control”. Vaccine. 20 (25–26): 3068–87. doi:10.1016/S0264-410X(02)00254-2. PMID 12163258.
- ↑ “Ten things you need to know about pandemic influenza”. World Health Organization. 14 October 2005. Archived from the original on 23 September 2009. Retrieved 26 September 2009.
- ↑ Valleron AJ, Cori A, Valtat S, Meurisse S, Carrat F, Boëlle PY (May 2010). “Transmissibility and geographic spread of the 1889 influenza pandemic”. Proc. Natl. Acad. Sci. U.S.A. 107 (19): 8778–81. Bibcode:2010PNAS..107.8778V. doi:10.1073/pnas.1000886107. PMC 2889325. PMID 20421481.
- ↑ Mills CE, Robins JM, Lipsitch M (December 2004). “Transmissibility of 1918 pandemic influenza”. Nature. 432 (7019): 904–6. Bibcode:2004Natur.432..904M. doi:10.1038/nature03063. PMID 15602562.
- ↑ Donaldson LJ; Rutter PD; Ellis BM; et al. (2009). “Mortality from pandemic A/H1N1 2009 influenza in England: public health surveillance study”. BMJ. 339: b5213. doi:10.1136/bmj.b5213. PMC 2791802. PMID 20007665. Unknown parameter
|author-separator=ignored (help) - ↑ Dawood, Fatimah S (26 June 2012). “Estimated global mortality associated with the first 12 months of 2009 pandemic influenza A H1N1 virus circulation: a modelling study”. The Lancet Infectious Diseases. 12 (9): 687–95. doi:10.1016/S1473-3099(12)70121-4. PMID 22738893. Retrieved 19 March 2014. Unknown parameter
|coauthors=ignored (help) - ↑ Shimizu, K (1997). “History of influenza epidemics and discovery of influenza virus”. Nippon Rinsho. 55 (10): 2505–201. PMID 9360364. Unknown parameter
|month=ignored (help) - ↑ Smith, W (1933). “A virus obtained from influenza patients”. Lancet. 2: 66–68. Unknown parameter
|coauthors=ignored (help) - ↑ Sir Frank Macfarlane Burnet: Biography The Nobel Foundation. Accessed 22 Oct 06
- ↑ Kendall, H (2006). “Vaccine Innovation: Lessons from World War II” (PDF). Journal of Public Health Policy. 27 (1): 38–57.
- ↑ “CDC Morbidity and Mortality Weekly Report (MMWR) – Influenza Activity”.
Classification
For more information about non-human (variant) influenza viruses that may be transmitted to humans, see Zoonotic influenza
Editor-In-Chief: C. Michael Gibson, M.S., M.D. [2]; Associate Editor(s)-in-Chief: Alejandro Lemor, M.D. [3]
Overview
Influenza virus can be classified into 3 main types: A, B and C. Based on the surface glycoproteins, hemagglutinin (HA) and neuraminidase (NA), influenza type A is further classified into several subtypes and can infect many species, including humans. Type B can only infect humans and type C is not common and causes only mild illness.
Classification
There are three types of influenza viruses: A, B, and C. Only influenza A viruses are further classified by subtype on the basis of the two main surface glycoproteins hemagglutinin (HA) and neuraminidase (NA). Influenza A subtypes and B viruses are further classified by strains.[1]
| Species | Hemagglutinin Subtypes |
Neuraminidase Subtypes |
|---|---|---|
| Humans | H1, H2, H3, H5, H6, H7, H9, H10 | N1, N2, N6, N7, N8, N9 |
| Poultry | H1, H2, H3, H4, H5, H6, H7, H8, H9, H10, H11, H12, H13, H14, H15, H16 | N1, N2, N3, N4, N5, N6, N7, N8, N9 |
| Pigs | H1, H2, H3, H4, H5, H9 | N1, N2 |
| Bats | H17, H18 | N10, N11 |
| Adapted from CDC [2] | ||
Influenza Type A and Its Subtypes
- Influenza type A viruses can infect people, birds, pigs, horses, and other animals, but wild birds are the natural hosts for these viruses. Influenza type A viruses are divided into subtypes identified by two proteins on the surface of the virus: hemagglutinin (HA) and neuraminidase (NA).
- For example, an “H7N2 virus” designates an influenza A subtype that has an HA 7 protein and an NA 2 protein; similarly an “H5N1” virus has an HA 5 protein and an NA 1 protein.
- There are 16 known HA subtypes and 9 known NA subtypes; many different combinations of HA and NA proteins are possible.
- Only some influenza A subtypes (i.e., H1N1, H1N2, and H3N2) are currently in general circulation among humans.
- Other subtypes are found most commonly in other animal species. For example, H7N7 and H3N8 viruses cause illness in horses, and H3N8 also has recently been shown to cause illness in dogs.
- Only influenza A viruses infect birds, and al known subtypes of influenza A viruses can infect birds.
- However, there are substantial genetic differences between the influenza A subtypes that typicaly infect birds and those that infect both people and birds.
- Three prominent subtypes of the avian influenza A viruses that are known to infect both birds and people are A H5, A H7, and A H9.
Influenza A H5
- Nine potential subtypes of H5 are known (H5N1, H5N2, H5N3, H5N4, H5N5, H5N6, H5N7, H5N8, and H5N9).
- Most H5 viruses identified worldwide in wild birds and poultry are LPAI (low pathogenic avian influenza) viruses.
- Sporadic H5 virus infection of humans, such as with highly pathogenic avian influenza A (H5N1) viruses currently circulating among poultry in Asia and the Middle East have been reported in 15 countries, often resulting in severe pneumonia with approximately 60% mortality worldwide.
|
|
![Genetic Evolution of H7N9 Virus in China Click on the image to expand. Image obtained from CDC [1]](https://www.wikidoc.org/index.php/File%3AH7n9-reassortment-diagram-sm.jpg)
Influenza A H7
- Nine potential subtypes of H7 are known (H7N1, H7N2, H7N3, H7N4, H7N5, H7N6, H7N7, H7N8, and H7N9).
- Most H7 viruses identified worldwide in wild birds and poultry are LPAI viruses.
- H7 virus infection in humans is uncommon, but has been documented in persons who have direct contact with infected birds, especially during outbreaks of H7 virus among poultry. Illness in humans may include conjunctivitis and/or upper respiratory tract symptoms.
- In humans, LPAI (H7N2, H7N3, H7N7) virus infections have caused mild to moderate illness.
- HPAI (high pathogenic avian influenza) virus infections, subtypes H7N3 and H7N7, have caused mild to severe and fatal illness.
Influenza A H9
- Nine potential subtypes of H9 are known (H9N1, H9N2, H9N3, H9N4, H9N5, H9N6, H9N7, H9N8, and H9N9)
- All H9 viruses identified worldwide in wild birds and poultry are LPAI viruses.
- H9N2 virus has been detected in bird populations in Asia, Europe, the Middle East and Africa.
- Rare, sporadic H9N2 virus infections of humans have been reported to cause generally mild upper respiratory tract illness.
Influenza Type B
- Influenza B viruses are usually found only in humans.
- Unlike influenza A viruses, these viruses are not classified according to subtype.
- Influenza B viruses can cause morbidity and mortality among humans, in general are associated with less severe epidemics than influenza A viruses.
- Although influenza type B viruses can cause human epidemics, they have not caused pandemics.
Influenza Type C
- Influenza type C viruses cause mild illness in humans and do not cause epidemics or pandemics.
- These viruses are not classified according to subtype.
Strains
- Influenza B viruses and subtypes of influenza A virus are further characterized into strains.
- There are many different strains of influenza B viruses and of influenza A subtypes.
- New strains of influenza viruses appear and replace older strains; this process occurs through antigenic drift.
- When a new strain of human influenza virus emerges, antibody protection that may have developed after infection or vaccination with an older strain may not provide protection against the new strain. Therefore, the influenza vaccine is updated on a yearly basis to keep up with the changes in influenza viruses.
References
Pathophysiology
For more information about non-human (variant) influenza viruses that may be transmitted to humans, see Zoonotic influenza
Editor-In-Chief: C. Michael Gibson, M.S., M.D. [3]; Associate Editor(s)-in-Chief: Alejandro Lemor, M.D. [4]
Overview
Influenza virus is under constant evolutionary change. These genetic changes may be small and chronic or large and abrupt. Small genetic changes happen continuously in Type A and Type B influenza as the virus makes copies of itself. This process is called antigenic drift. Drifting happens frequently enough to make new strains of virus unrecognizable to the human immune system. Type A influenza also undergoes infrequent and sudden changes known as antigenic shift. Antigenic shift occurs when two different flu strains infect the same cell and combine portions of their genetic material. The novel assortment of HA and/or NA proteins in a shifted virus may create a new influenza A subtype. Influenza viruses spread mainly through tiny droplets expelled when people with the disease cough, sneeze, or talk.
Pathophysiology
- Most healthy adults may be able to infect other people beginning 1 day before symptoms develop and up to 5 to 7 days after becoming sick.
- Children may pass the virus for longer than 7 days.
- Symptoms start 1 to 4 days after the virus enters the body, that means that infected patients are able to pass transmit the disease to someone else before knowing they are sick.
- Some people can be infected with the flu virus but have no symptoms. During this time, those persons may still spread the virus to others.
- Influenza viruses are constantly changing. They can change in two different ways, the antigenic drift and the antigenic shift.
 |
 |
Antigenic Drift[1]
- These are small changes in the genes of influenza viruses that happen continually over time as the virus replicates.
- These small genetic changes usually produce viruses that are pretty closely related to one another, which can be illustrated by their location close together on a phylogenetic tree.
- Viruses that are closely related to each other usually share the same antigenic properties and an immune system exposed to an similar virus will usually recognize it and respond. (This is sometimes called cross-protection.)
- But these small genetic changes can accumulate over time and result in viruses that are antigenically different (further away on the phylogenetic tree).
- When this happens, the body’s immune system may not recognize those viruses.
- This process works as follows:
- A person infected with a particular flu virus develops antibody against that virus.
- As antigenic changes accumulate, the antibodies created against the older viruses no longer recognize the “newer” virus, and the person can get sick again.
- Genetic changes that result in a virus with different antigenic properties is the main reason why people can get the flu more than one time.
- This is also why the flu vaccine composition must be reviewed each year, and updated as needed to keep up with evolving viruses.
Antigenic Shift
Adapted from CDC [1]
- Antigenic shift is an abrupt, major change in the influenza A viruses, resulting in new hemagglutinin and/or new hemagglutinin and neuraminidaseproteins in influenza viruses that infect humans.
- Shift results in a n ew influenza A subtype or a virus with a hemagglutinin or a hemagglutinin and neuraminidase combination that has emerged from an animal population that is so different from the same subtype in humans that most people do not have immunity to the new (e.g. novel) virus.
- Such a “shift” occurred in the spring of 2009, when an H1N1 virus with a new combination of genes emerged to infect people and quickly spread, causing a pandemic.
- When shift happens, most people have little or no protection against the new virus.
- While influenza viruses are changing by antigenic drift all the time, antigenic shift happens only occasionally.
- Influenza type A viruses undergo both kinds of changes
- Influenza type B viruses change only by the more gradual process of antigenic drift.
-
![Antigenic Drift Click on the image to expand. Image courtesy of the National Institute of Allergy and Infectious Diseases (NIAID) [1]](https://www.wikidoc.org/images/0/0d/Antigenic_Drift_Influenza.jpg) Antigenic Drift
Antigenic Drift
Click on the image to expand.
Image courtesy of the National Institute of Allergy and Infectious Diseases (NIAID) [1] -
![Antigenic Shift Click on the image to expand. Image courtesy of the National Institute of Allergy and Infectious Diseases (NIAID) [2]](https://www.wikidoc.org/images/6/6c/Antigenic_Shift_Influenza.jpg) Antigenic Shift
Antigenic Shift
Click on the image to expand.
Image courtesy of the National Institute of Allergy and Infectious Diseases (NIAID) [2]
![Antigenic Drift Click on the image to expand. Image courtesy of the National Institute of Allergy and Infectious Diseases (NIAID) [1]](https://www.wikidoc.org/index.php/File%3AAntigenic_Drift_Influenza.jpg)
![Antigenic Shift Click on the image to expand. Image courtesy of the National Institute of Allergy and Infectious Diseases (NIAID) [2]](https://www.wikidoc.org/index.php/File%3AAntigenic_Shift_Influenza.jpg)
Cellular Pathogenesis
 |
Transmission
Person-to-person Transmission Adapted from CDC [2]
- People with influenza infection can spread the disease to others up to about 6 feet away.
- Most experts think that influenza viruses are spread mainly by droplets made when people with flu cough, sneeze or talk.
- These droplets can land in the mouths or noses of people who are nearby or possibly be inhaled into the lungs.
- Less often, a person might also get flu by touching a surface or object that has flu virus on it and then touching their own mouth or nose.
- To avoid this, people should stay away from sick people and stay home if sick.
- It also is important to wash hands often with soap and water.
- If soap and water are not available, use an alcohol-based hand rub.
- Linens, eating utensils, and dishes belonging to those who are sick should not be shared without washing thoroughly first.
- Eating utensils can be washed either in a dishwasher or by hand with water and soap and do not need to be cleaned separately. Further, frequently touched surfaces should be cleaned and disinfected at home, work and school, especially if someone is ill.
Animal-to-person Transmission Adapted from CDC [3]
| Species | Hemagglutinin Subtypes |
Neuraminidase Subtypes |
|---|---|---|
| Humans | H1, H2, H3, H5, H6, H7, H9, H10 | N1, N2, N6, N7, N8, N9 |
| Poultry | H1, H2, H3, H4, H5, H6, H7, H8, H9, H10, H11, H12, H13, H14, H15, H16 | N1, N2, N3, N4, N5, N6, N7, N8, N9 |
| Pigs | H1, H2, H3, H4, H5, H9 | N1, N2 |
| Bats | H17, H18 | N10, N11 |
| Adapted from CDC [3] | ||
- Influenza A viruses are found in many different animals, including ducks, chickens, pigs, whales, horses and seals.
- Influenza B viruses circulate widely only among humans.
- Influenza A viruses are divided into subtypes based on two proteins on the surface of the virus: the hemagglutinin (H) and the neuraminidase (N).
- There are 18 different hemagglutinin subtypes and 11 different neuraminidase subtypes. All known subtypes of influenza A viruses have been found among birds, except subtype H17N10 and H18N11 which have only been found in bats.
- Wild birds are the primary natural reservoir for all subtypes of influenza A viruses and are thought to be the source of influenza A viruses in all other animals.
- Most influenza viruses cause asymptomatic or mild infection in birds; however, the range of symptoms in birds varies greatly depending on the properties of the virus.
- Infection with certain avian influenza A viruses (for example, some H5 and H7 viruses) can cause widespread, severe disease and death among some species of wild and especially domestic birds such as chickens and turkeys.
- Pigs can be infected with both human and avian influenza viruses in addition to swine influenza viruses.
- Infected pigs get symptoms similar to humans, such as cough, fever and runny nose. Because pigs are susceptible to avian, human and swine influenza viruses, they potentially may be infected with influenza viruses from different species (e.g., ducks and humans) at the same time. If this happens, it is possible for the genes of these viruses to mix and create a new virus.
- If a pig were infected with a human influenza virus and an avian influenza virus at the same time, the viruses could mix (reassort) and produce a new virus that had most of the genes from the human virus, but a hemagglutinin and/or neuraminidase from the avian virus.
- The resulting new virus would likely be able to infect humans and spread from person to person, but it would have surface proteins (hemagglutinin and/or neuraminidase) not previously seen in influenza viruses that infect humans.
- While it is unusual for people to get influenza infections directly from animals, sporadic human infections and outbreaks caused by certain avian influenza A viruses have been reported.
Asthmatic Patients
- Patients with asthma are not more likely to get influenza but the disease can be more serious for them.
- Even if their asthma is mild or their symptoms are well-controlled by medication.
- This is because patients with asthma have swollen and sensitive airways, and influenza can cause further inflammation of the airways and lungs.
- Influenza infection in the lungs can trigger asthma attacks and a worsening of asthma symptoms.
- Adults and children with asthma are more likely to develop pneumonia after getting sick with the flu than people who do not have asthma.
References
Causes
For more information about non-human (variant) influenza viruses that may be transmitted to humans, see Zoonotic influenza
Editor-In-Chief: C. Michael Gibson, M.S., M.D. [2]; Associate Editor(s)-in-Chief: Alejandro Lemor, M.D. [3]
Overview
Influenza infection is caused by the influenza virus that belong to the family Orthomyxoviridae. Three types of influenza virus have been reported to cause clinical illness in humans: types A, B, and C. Influenza virus can be found in humans, as well as in poultry, pigs, and bats.
Taxonomy
Viruses; ssRNA viruses; ssRNA negative-strand viruses; Orthomyxoviridae; Influenzavirus A; Influenza A virus[1]
Viruses; ssRNA viruses; ssRNA negative-strand viruses; Orthomyxoviridae; Influenzavirus B; Influenza B virus[1]
Viruses; ssRNA viruses; ssRNA negative-strand viruses; Orthomyxoviridae; Influenzavirus C; Influenza C virus[1]
- Orthomyxoviridae
- Influenzavirus A
- Influenza A virus
- (many subtypes)
- Influenzavirus B
- Influenza B virus
- (many subtypes)
- Influenzavirus C
- Influenza C virus
- (many subtypes)
- The international naming convention for influenza viruses uses the following components to name the virus:[2]
- The antigenic type (A, B, C)
- The host of origin (Swine, equine, chicken, etc. For human-origin viruses, no host of origin designation is given.)
- Geographical origin (e.g., Hong Kong, Denver, Taiwan)
- Strain number (e.g., 15, 7)
- Year of isolation (e.g., 57, 2009)
- For influenza A viruses, the hemagglutinin and neuraminidase antigen description in parentheses (e.g.,(H1N1), (H5N1)).
Influenza A
- Influenza A viruses are divided into subtypes based on two proteins on the surface of the virus: the hemagglutinin (H) and the neuraminidase (N).
- There are 18 different hemagglutinin subtypes and 11 different neuraminidase subtypes. (H1 through H18 and N1 through N11 respectively.)
- Influenza A viruses can be further broken down into different strains.
- Current subtypes of influenza A viruses found in people are influenza A (H1N1) and influenza A (H3N2) viruses.
- In the spring of 2009, a new influenza A (H1N1) virus (CDC 2009 H1N1 Flu website) emerged to cause illness in people.
- This virus was very different from the human influenza A (H1N1) viruses circulating at that time.
- The new virus caused the first influenza pandemic in more than 40 years.
- That virus (often called “2009 H1N1”) has now replaced the H1N1 virus that was previously circulating in humans.
Influenza B
- Influenza B viruses are not divided into subtypes, but can be further broken down into lineages and strains.
- Currently circulating influenza B viruses belong to one of two lineages: B/Yamagata and B/Victoria.
Structure
 |
- Influenza viruses (A, B and C) are very similar in overall structure, they arre single-stranded, enveloped, negative-sense RNA viruses.
- Influenza virus replicate inside the nucleus of the host-cell.
- The virus particle is 80–120 nanometers in diameter and usually roughly spherical, although filamentous forms can occur.[3][4]
- These filamentous forms are more common in influenza C, which can form cordlike structures up to 500 micrometers long on the surfaces of infected cells.
- The viral envelope contains two main types of glycoproteins, wrapped around a central core.
- The central core contains the viral RNA genome and other viral proteins that package and protect this RNA.
- RNA tends to be single stranded but in special cases it is double.[4] Unusually for a virus, its genome is not a single piece of nucleic acid; instead, it contains seven or eight pieces of segmented negative-sense RNA, each piece of RNA containing either one or two genes, which code for a gene product (protein).
- The influenza A genome contains 11 genes on eight pieces of RNA, encoding for 11 proteins: hemagglutinin (HA), neuraminidase (NA), nucleoprotein (NP), M1, M2, NS1, NS2(NEP: nuclear export protein), PA, PB1 (polymerase basic 1), PB1-F2 and PB2.[5]
- Hemagglutinin (HA) and neuraminidase (NA) are the two large glycoproteins on the outside of the viral particles.
- HA is a lectin that mediates binding of the virus to target cells and entry of the viral genome into the target cell, while NA is involved in the release of progeny virus from infected cells, by cleaving sugars that bind the mature viral particles.[6]
- These proteins are targets for antiviral drugs[7] and antigens to which antibodies can be raised.
Tropism
- The viruses attach to cells within the nasal passages and throat in the respiratory tract.
- The influenza virus’s hemagglutinin (HA) surface proteins then bind to the sialic acid receptors on the surface of a human respiratory tract cell.
- The structure of the influenza virus’s HA surface proteins is designed to fit the sialic acid receptors of the human cell, like a key to a lock.
- Once the key enters the lock, the influenza virus is then able to enter and infect the cell. This marks the beginning of a flu infection
Natural Reservoir
| Species | Hemagglutinin Subtypes |
Neuraminidase Subtypes |
|---|---|---|
| Humans | H1, H2, H3, H5, H6, H7, H9, H10 | N1, N2, N6, N7, N8, N9 |
| Poultry | H1, H2, H3, H4, H5, H6, H7, H8, H9, H10, H11, H12, H13, H14, H15, H16 | N1, N2, N3, N4, N5, N6, N7, N8, N9 |
| Pigs | H1, H2, H3, H4, H5, H9 | N1, N2 |
| Bats | H17, H18 | N10, N11 |
| Adapted from CDC [8] | ||
- In nature, the flu virus is found in wild aquatic birds, such as ducks and shore birds.
- It has persisted in these birds for millions of years and does not typically harm them; but the frequently mutating flu viruses can readily jump the species barrier from wild birds to domesticated poultry and swine.
- Pigs can be infected by both bird (avian) flu and the form that infects humans.
- In a setting such as a farm where chickens, pigs, and humans live in close proximity, pigs act as an influenza virus mixing bowl.
- If a pig is infected with avian and human flu simultaneously, the two types of virus may exchange genes.
- Such a “reassorted” flu virus can sometimes spread from pigs to people.
- Depending on the combination of avian flu proteins that make it into the human population, the flu may be more or less severe.
- In 1997, for the first time, scientists found that a form of avian H5N1 flu skipped the pig step and infected humans directly.
- Alarmed health officials feared a worldwide epidemic (a pandemic), but fortunately, the virus could not pass from person to person and thus did not spark an epidemic.
Microscopic Pathology
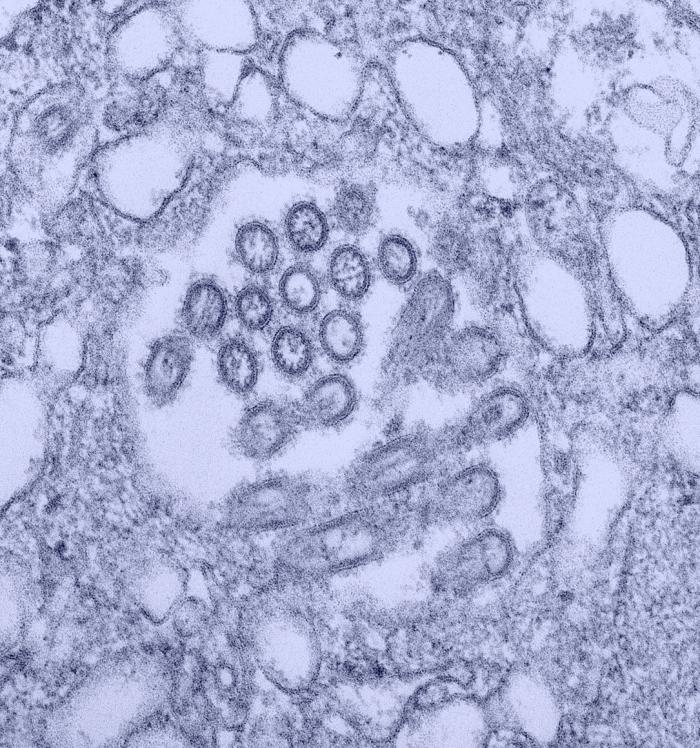
-
 Electron Micrograph Images of H7N9 Virus from China.
Image obtained from CDC. -
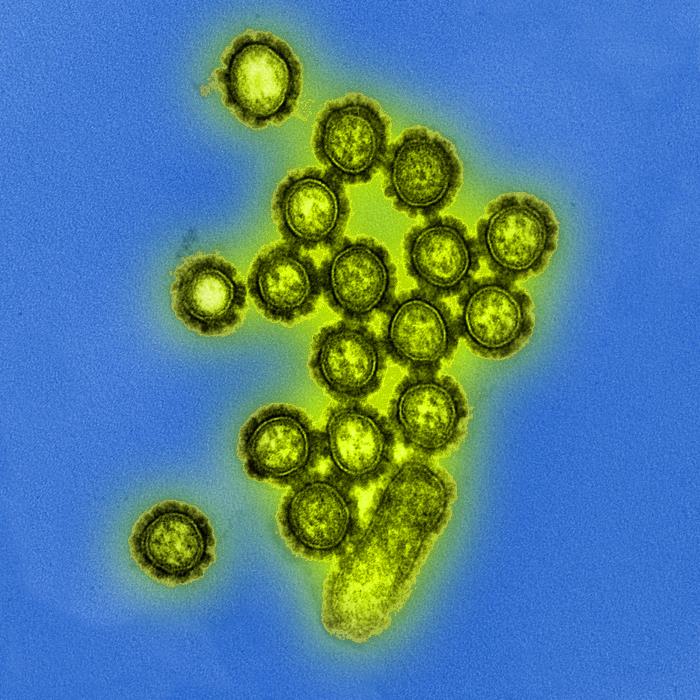 Produced by the National Institute of Allergy and Infectious Diseases (NIAID), this digitally-colorized transmission electron micrograph (TEM) depicts numbers of H1N1 influenza virus particles. Surface proteins located on the surface of the virus particles are shown in black.
Image obtained from Public Health Image Library (PHIL). -
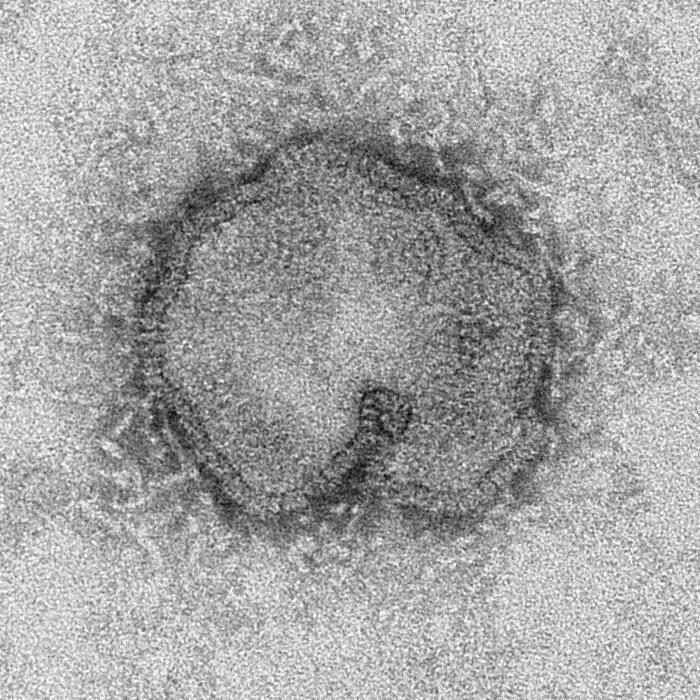 This negatively-stained transmission electron micrograph (TEM) captured some of the ultrastructural details exhibited by the new influenza A (H7N9) virus.
Image obtained from Public Health Image Library (PHIL). -
 This colorized transmission electron micrograph (TEM) revealed the presence of a number of Novel H1N1 virus virions in this tissue culture sample.
Image obtained from Public Health Image Library (PHIL). -
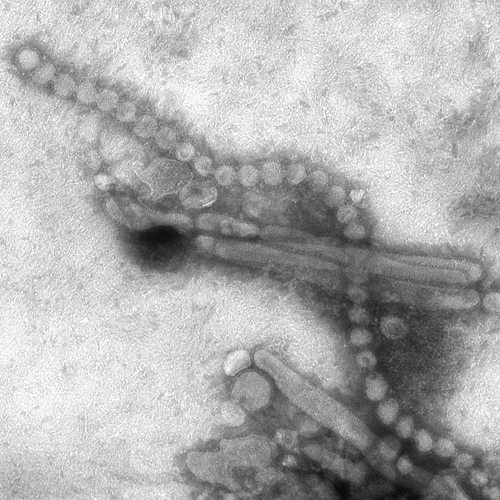
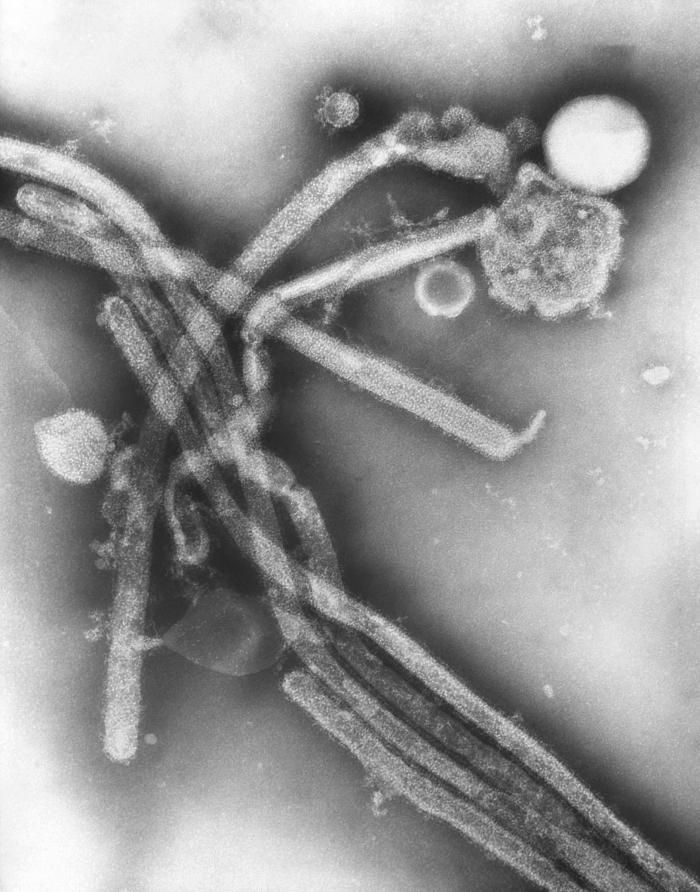 This negatively-stained transmission electron micrograph (TEM) revealed the presence of a number of Hong Kong flu virus virions, the H3N2 subtype of the influenza A virus.
Image obtained from Public Health Image Library (PHIL).


References
- ↑ 1.0 1.1 1.2 >“Taxonomy browser (Influenzavirus)”.
- ↑ “CDC Types of Influenza Viruses”.
- ↑ International Committee on Taxonomy of Viruses. “The Universal Virus Database, version 4: Influenza A”.
- ↑ 4.0 4.1 Lamb RA, Choppin PW (1983). “The gene structure and replication of influenza virus”. Annu. Rev. Biochem. 52: 467–506. doi:10.1146/annurev.bi.52.070183.002343. PMID 6351727.
- ↑ Ghedin, E; Sengamalay, NA; Shumway, M; Zaborsky, J; Feldblyum, T; Subbu, V; Spiro, DJ; Sitz, J; Koo, H (October 2005). “Large-scale sequencing of human influenza reveals the dynamic nature of viral genome evolution”. Nature. 437 (7062): 1162–6. Bibcode:2005Natur.437.1162G. doi:10.1038/nature04239. PMID 16208317.
- ↑ Suzuki, Y (2005). “Sialobiology of influenza: molecular mechanism of host range variation of influenza viruses”. Biol Pharm Bull. 28 (3): 399–408. doi:10.1248/bpb.28.399. PMID 15744059.
- ↑ Wilson, J; von Itzstein M (July 2003). “Recent strategies in the search for new anti-influenza therapies”. Curr Drug Targets. 4 (5): 389–408. doi:10.2174/1389450033491019. PMID 12816348.
- ↑ “CDC Seasonal Influenza – Transmission of Influenza Viruses from Animals to People”.
Differentiating Influenza from other Diseases
For more information about non-human (variant) influenza viruses that may be transmitted to humans, see Zoonotic influenza
Editor-In-Chief: C. Michael Gibson, M.S., M.D. [1] ; Associate Editor(s)-in-Chief: Alejandro Lemor, M.D. [2]
Overview
Influenza should be differentiated from other conditions that cause fever, cough, myalgias, headache and fatigue, such as RSV infection, dengue fever, parainfluenza virus infection, ebola infection adenovirus infection, rhinovirus infection, and legionella infection.
Differential Diagnosis
Influenza should be differentiated from the following diseases or pathogens that cause upper or lower respiratory disease or flu-like symptoms:[1][2]
Infectious Diseases
- Other influenza viruses, such as human influenza or swine influenza are in the differential diagnosis of avian influenza.
- Other infectious agents, including viruses, bacteria, fungi, and parasites, that are typically responsible for respiratory illness are also in the differential diagnosis of avian influenza:
- Adenoviruses
- Anthrax (caused by B. anthracis)
- Arenaviruses
- Cytomegalovirus (CMV)
- Chlamydia pneumoniae
- Coronaviruses (responsible for SARS and MERS)
- Dengue fever
- Echoviruses
- Ebola virus infection
- Hantavirus pulmonary syndrome
- Herpes viruses
- HIV disease
- Histoplasmosis and other fungal causes of respiratory disease
- Human metapneumovirus
- Malaria
- Measles
- Parainfluenza virus
- Poliovirus infection
- Q fever
- Rhinovirus
- Respiratory syncytial virus
- Other bacterial causes of nasopharyngeal and respiratory infection, such as S. pneumoniae, S. aureus, H. influenzae, M. pneumoniae, M. tuberculosis, L. pneumophila.
Non-infectious Diseases
- Asthma
- Bronchiectasis
- Chronic obstructive pulmonary disease and emphysema
- Drugs, such as interferons, monoclonal antibodies, bisphosphonates, and chemotherapeutic agents
- Hematologic malignancies (leukemias and lymphomas)
- Myocarditis
- Metal fume fever
- Pericarditis
- Pulmonary embolism
- Vaccinations (typically transient and mild flu-like illness)
Differentiating Flu and Common Cold
| Symptoms | Flu | Common Cold |
|---|---|---|
| Fever | High fever (100-102° F) | Rare |
| Headache | Common | Rare |
| Cough | Common, moderate to severe | Mild to moderate |
| Body aches | Common, may be severe | Slight |
| Fatigue | Usual, can last up to 2-3 weeks | Sometimes |
| Nasal congestion | Sometimes | Common |
| Sneezing | Sometimes | Common |
| Sore throat | Sometimes | Common |
| Adapted from the National Institute of Allergy and Infectious Diseases (NIAID) [3] | ||
| Disease | Clinical Manifestations | Lab findings | Imaging findings | Main treatment | ||||||||
|---|---|---|---|---|---|---|---|---|---|---|---|---|
| Cough | Sputum | Dyspnea | Sore throat | Headache | Confusion | Diarrhea | Hyponatremia | Leukopenia | Abnormal Liver function tests | |||
| Influenza | ++ | ++ | ++ | ++ | ++ | +/- | +/- | – | – | – |
|
Zanamivir, oseltamivir |
| Psittacosis | ++ | – | + | – | +++ | + | Minimal | – | + | – |
|
Doxycycline |
| C.pneumoniae pneumonia | + | + | + | +++ | ++ | + | – | – | – | – |
|
Doxycycline, azithromycin |
| M. pneumoniae pneumonia | ++ | ++ | ++ | – | – | – | – | – | – | + |
|
Doxycycline |
| L. pneumophila infection | + | +++ | +++ | – | + | ++ | + | ++ | + | ++ |
|
Doxycycline |
| Endocarditis | ++ | ++ | + | – | – | – | – | – | +/- | +/- |
|
Vancomycin |
| Coxiella burnetii infection | ++ | – | + | +/- | – | +/- | Minimal | – | +/- | +/- |
|
Doxycycline |
| Leptospirosis | ++ | + | ++ | + | + | ++ | – | +++ |
|
Doxycycline, azithromycin, amoxicillin | ||
| Brucellosis | ++ | – | + | – | ++ | + | – | +/- | +/- | +/- |
|
Doxycycline, rifampin |
Key;
+: Occurs in some cases
++: Occurs in many cases
+++: Occurs frequently
References
- ↑ Szewczuk, Elektra; Thapa, Kiran; Anninos, Terry; McPhie, Kenneth; Higgins, Geoff; Dwyer, Dominic E; Stanley, Keith K; Iredell, Jonathan R (2010). “Rapid semi-automated quantitative multiplex tandem PCR (MT-PCR) assays for the differential diagnosis of influenza-like illness”. BMC Infectious Diseases. 10 (1): 113. doi:10.1186/1471-2334-10-113. ISSN 1471-2334.
- ↑ Liu, Ding Xiang; Schulze, Martin; Nitsche, Andreas; Schweiger, Brunhilde; Biere, Barbara (2010). “Diagnostic Approach for the Differentiation of the Pandemic Influenza A(H1N1)v Virus from Recent Human Influenza Viruses by Real-Time PCR”. PLoS ONE. 5 (4): e9966. doi:10.1371/journal.pone.0009966. ISSN 1932-6203.
- ↑ “National Institute of Allergy and Infectious Diseases (NIAID)- Flu (Influenza)”.
Epidemiology and Demographics
For more information about non-human (variant) influenza viruses that may be transmitted to humans, see Zoonotic influenza
Editor-In-Chief: C. Michael Gibson, M.S., M.D. [5]; Associate Editor(s)-in-Chief: Alejandro Lemor, M.D. [6]
Overview
The CDC estimates that 5 to 20 percent of Americans are affected by the flu during each flu season, which typically lasts from October to March. Children are 2 to 3 times more likely than adults to get sick with the flu, and children frequently spread the virus to others. For elderly people, newborn babies, pregnant women, and people with certain chronic illnesses, the flu and its complications can be life-threatening. Although most people recover from the illness, between 3,000 and 49,000 US citizens die from the flu and its complications every year.[1]
Epidemiology and Demographics
Prevalence
- Influenza affects approximately 5 to 10% of adults and 20 to 30% of children worldwide.
- WHO reports 3 to 5 million cases of severe influenza disease, with approximately 250 000 to 500 000 deaths.[2]
Gender
- There is no gender predominance for influenza infection. However, pregnant women are at increased risk of having severe illness and possible complications.
Age
- Influenza viruses cause disease among persons in all age groups.
- Rates of infection are highest among children, but the risks for complications, hospitalizations, and deaths from influenza are higher among persons aged 65 years and older, young children, and persons of any age who have medical conditions that place them at increased risk for complications from influenza (such as immunosuppression and pregnancy).
- During 1990–1999, estimated average rates of influenza-associated pulmonary and circulatory deaths per 100,000 persons were:[3]
- 0.4-0.6 among persons aged 0-49 years
- 7.5 among persons aged 50-64 years
- 98.3 among persons aged 65 years and older.
Mortality
Vaccination
The following data represents the percentage of individuals who received influenza vaccine in the United States:[4]
- 45.2% of children from 6 months to 17 years old received an influenza vaccination during the past 12 months.
- 26.3% of adults aged 18 to 49 years received an influenza vaccination during the past 12 months.
- 42.7% of adults aged 50 to 64 years received an influenza vaccination during the past 12 months.
- 66.5% of adults aged 65 years and over received an influenza vaccination during the past 12 months.
 Image obtained from CDC[1] |
 Image obtained from CDC[2] |
Influenza in the United States
National and Regional Summary of Select Surveillance Components
- The proportion of outpatient visits for influenza-like illness (ILI) was 1.4%, which is below the national baseline of 2.0%. One region reported ILI above their region-specific baseline level.
- Puerto Rico experienced high ILI activity; one state experienced low ILI activity; New York City and 49 states experienced minimal ILI activity and the District of Columbia had insufficient data.
- The geographic spread of influenza in Guam was reported as widespread; Puerto Rico and five states reported local activity; the U.S. Virgin Islands and 36 states reported sporadic activity; and the District of Columbia and nine states reported no influenza activity.
| HHS Surveillance Regions | Out-patient ILI† | Percentage positive for flu‡ | Number of jurisdictions reporting regional or widespread activity§ | 2009 H1N1 | Type A (H3) | Type A (Subtyping not performed) |
Type B | Pediatric Deaths |
|---|---|---|---|---|---|---|---|---|
| Nation | Normal | 4.8% | 1 of 54 | 7 | 267 | 405 | 392 | 1 |
| Region 1 | Normal | 1.6% | 0 of 6 | 0 | 8 | 8 | 4 | 0 |
| Region 2 | Elevated | 1.1% | 0 of 4 | 1 | 17 | 17 | 11 | 0 |
| Region 3 | Normal | 1.7% | 0 of 6 | 0 | 16 | 16 | 69 | 0 |
| Region 4 | Normal | 8.0% | 0 of 8 | 0 | 56 | 290 | 246 | 1 |
| Region 5 | Normal | 2.1% | 0 of 6 | 3 | 28 | 15 | 12 | 0 |
| Region 6 | Normal | 4.3% | 0 of 5 | 2 | 32 | 26 | 69 | 0 |
| Region 7 | Normal | 1.9% | 0 of 4 | 0 | 12 | 15 | 9 | 0 |
| Region 8 | Normal | 1.2% | 0 of 6 | 0 | 15 | 5 | 6 | 0 |
| Region 9 | Normal | 3.2% | 1 of 5 | 1 | 27 | 27 | 19 | 0 |
| Region 10 | Normal | 5.5% | 0 of 4 | 0 | 56 | 4 | 7 | 0 |
|
*HHS regions (Region 1 CT, ME, MA, NH, RI, VT; Region 2: NJ, NY, Puerto Rico, US Virgin Islands; Region 3: DE, DC, MD, PA, VA, WV; Region 4: AL, FL, GA, KY, MS, NC, SC, TN; Region 5: IL, IN, MI, MN, OH, WI; Region 6: AR, LA, NM, OK, TX; Region 7: IA, KS, MO, NE; Region 8: CO, MT, ND, SD, UT, WY; Region 9: AZ, CA, Guam, HI, NV; and Region 10: AK, ID, OR, WA). | ||||||||
 Image obtained from CDC [3] |
 Image obtained from CDC [4] |
Worldwide Influenza
- During May 18–September 20, typical seasonal patterns of influenza activity occurred in temperate climate Southern Hemisphere countries.
South and Central America
- In temperate countries of South America, influenza activity began to increase in June, remained elevated through July and mid-August, and decreased in September. Influenza A viruses were reported more frequently than influenza B viruses, and influenza A (H3N2) viruses were predominant in Chile, Argentina, Uruguay, and Paraguay.
- In tropical South America, influenza A viruses were most commonly reported. Influenza A (H3N2) viruses predominated in Brazil and Colombia, whereas influenza B viruses were more frequently reported in Ecuador. In Peru, influenza A (H3N2) and pH1N1 viruses cocirculated, but influenza B viruses also were identified.
- In the Caribbean and Central America, an increase in the number of influenza B viruses was reported in July and August, particularly in Honduras, Jamaica, and Nicaragua, with influenza A viruses cocirculating in Guatemala and Panama.
Europe and North America
- In Europe and North America, influenza activity was low, and small numbers of pH1N1, influenza A (H3N2), and influenza B viruses were identified.
Asia
- In South Asia and Southeast Asia, a decrease in influenza activity was observed during August and September, and influenza A (H3N2) predominated in Cambodia, India, China, and Vietnam, with smaller numbers of influenza B viruses reported.
- In Thailand, influenza B viruses were more frequently reported in July and August, but influenza A (H3N2) and pH1N1 viruses also were identified.
South Africa
- In South Africa, influenza activity began to increase in late May and decreased in early August. Influenza A (H3N2) viruses predominated in that country, but pH1N1 and influenza B viruses also were reported.
Australia and New Zealand
- In Australia and New Zealand, influenza activity began to increase in late July and remained elevated through mid-September. Influenza A viruses predominated in both countries.
References
Risk Factors
For more information about non-human (variant) influenza viruses that may be transmitted to humans, see Zoonotic influenza
Editor-In-Chief: C. Michael Gibson, M.S., M.D. [1]; Associate Editor(s)-in-Chief: Alejandro Lemor, M.D. [2]
Overview
Risk factors for influenza include those that increase exposure to the virus such as healthcare settings, nursing homes, and daycare. Additionally, there are certain groups that are at risk for more severe disease and complications, particularly children younger than 2 years old, adults aged 65 or older, pregnant women, patients with comorbidities, asthmatic patients, and patients with a weakened immune system.
Risk Factors
- Healthcare workers are at a higher risk of developing influenza infection due to their exposure to patients in the daily bases.
- Persons at higher risk for severe influenza disease and complications include the following conditions shown in the table below.
| High Risk for Developing Flu-Related Complications | |
|---|---|
|
|
|
|
|
|
|
|
|
|
|
|
|
|
|
|
| Adapted from CDC [1] | |
References
Natural History, Complications and Prognosis
For more information about non-human (variant) influenza viruses that may be transmitted to humans, see Zoonotic influenza
Editor-In-Chief: C. Michael Gibson, M.S., M.D. [1]; Associate Editor(s)-in-Chief: ; Ammu Susheela, M.D. [2]
Overview
The incubation period of influenza is 1 to 4 days. Uncomplicated influenza can present with constitutional symptoms and can resolve within 3-7 days; while more complex disease may be observed with patients developing pneumonia, otitis, encephalitis and sepsis.
Natural History
Transmission
- Influenza viruses are spread from person to person primarily through large-particle respiratory droplet transmission
- Contact with respiratory-droplet contaminated surfaces is another possible source of transmission.
- Airborne transmission (via small-particle residue [less than or equal to 5µm] of evaporated droplets that might remain suspended in the air for long periods of time) also is thought to be possible, although data supporting airborne transmission are limited.
Incubation Period
- The typical incubation period for influenza is 1-4 days (average: 2 days).
- Adults shed influenza virus from the day before symptoms begin through 5-10 days after illness onset.
- Young children also might shed virus several days before illness onset, and children can be infectious for 10 or more days after onset of symptoms. Severely immunocompromised persons can shed virus for weeks or months.
Progression
- Uncomplicated influenza illness is characterized by the abrupt onset of constitutional and respiratory signs and symptoms (e.g., fever, myalgia, headache, malaise, nonproductive cough, sore throat, and rhinitis).
- Among children,otitis media, nausea, and vomiting also are commonly reported with influenza illness.
- Uncomplicated influenza illness typically resolves after 3-7 days for the majority of persons, although cough and malaise can persist for >2 weeks.
- Influenza virus infections can cause primary influenza viral pneumonia; exacerbate underlying medical conditions (e.g., pulmonary or cardiac disease); lead to secondary bacterial pneumonia, sinusitis, or otitis media; or contribute to coinfections with other viral or bacterial pathogens.
- Young children with influenza virus infection might have initial symptoms mimicking bacterial sepsis with high fever, and febrile seizures have been reported in 6%-20% of children hospitalized with influenza virus infection.
- Influenza virus infection also has been uncommonly associated with encephalopathy, transverse myelitis, myositis, myocarditis, pericarditis, and Reye syndrome.
- Respiratory illnesses caused by influenza virus infection are difficult to distinguish from illnesses caused by other respiratory pathogens on the basis of signs and symptoms alone.
- Young children are less likely to report typical influenza symptoms (e.g., fever and cough).
- In the United States, annual epidemics of influenza typically occur during the fall or winter months, but the peak of influenza activity can occur as late as April or May
- Influenza-related complications requiring urgent medical care, including hospitalizations or deaths, can result from the direct effects of influenza virus infection, from complications associated with age or pregnancy, or from complications of underlying cardiopulmonary conditions or other chronic diseases.
- Influenza viruses cause disease among persons in all age groups.
- Rates of infection are highest among children, but the risks for complications, hospitalizations, and deaths from influenza are higher among persons aged 65 years and older, young children, and persons of any age who have medical conditions that place them at increased risk for complications from influenza.
Complications
Possible complications of influenza, especially for those at high risk, include:
Prognosis
Anyone at any age can have serious complications from the flu, but those at highest risk include:
- People over age 50
- Children between 6 months and 2 years
- Women more than 3 months pregnant during the flu season
- Anyone living in a long-term care facility
- Anyone with chronic heart, lung, or kidney conditions, diabetes, or a weakened immune system
In most individuals who are otherwise healthy, the flu goes away within 7 to 10 days.[1]
References
Diagnosis
Diagnosis
History and Symptoms | Physical Examination | Laboratory Findings | Chest X Ray | Other Diagnostic Studies
Treatment
Treatment
Medical Therapy | Primary Prevention | Cost-Effectiveness of Therapy | Future or Investigational Therapies
Related Chapters
Related Chapters
- Information concerning flu research can be found at
- Influenza research
- H5N1 clinical trials
- Center for Biologics Evaluation and Research
- H5N1 genetic structure
- ICEID
- Influenza Genome Sequencing Project
- Cytokine storm
- International Partnership on Avian and Pandemic Influenza
- National Influenza Centers
- Pandemic Preparedness and Response Act
- Global Alliance for Vaccines and Immunization
- IFPMA International Federation of Pharmaceutical Manufacturers Associations
- Reporting disease cases
- Original antigenic sin
- Center for Biologics Evaluation and Research
- ICEID
- Influenza Genome Sequencing Project
- Cytokine storm
- International Partnership on Avian and Pandemic Influenza
- National Influenza Centers
- Pandemic Preparedness and Response Act
Further Readings
Further Readings
|
Template:Col-1-of-2General
|
External Links
External Links
- Info on influenza at CDC
- Fact Sheet Overview of influenza at World Health Organization
- Orthomyxoviridae The Universal Virus Database of the International Committee on Taxonomy of Viruses
- Influenza Virus Resource from the NCBI
Template:Respiratory pathology Template:Viral diseases
ar:فيروس إنفلونزا bg:Грип ca:Grip cs:Chřipka cy:Y ffliw da:Influenza de:Influenza el:Γρίπη eo:Gripo eu:Gripe fa:آنفلوآنزا fi:Influenssa gl:Gripe he:שפעת hr:Gripa id:Influensa io:Influenzo it:Influenza kk:Тұмау ko:인플루엔자 lv:gripa hu:Influenza nl:Griep nn:Influensa no:Influensa simple:Influenza sk:Chrípka sl:Gripa sr:Грип sq:Gripi sv:Influensa th:ไข้หวัดใหญ่ wa:Virûsse del gripe yi:פלו zh-min-nan:Liû-hêng-sèng kám-mō͘ Template:WH Template:WS
Looking for the patient version?
© 2026 MyEClinic – IFTM Institut für Telematik in der Medizin GmbH